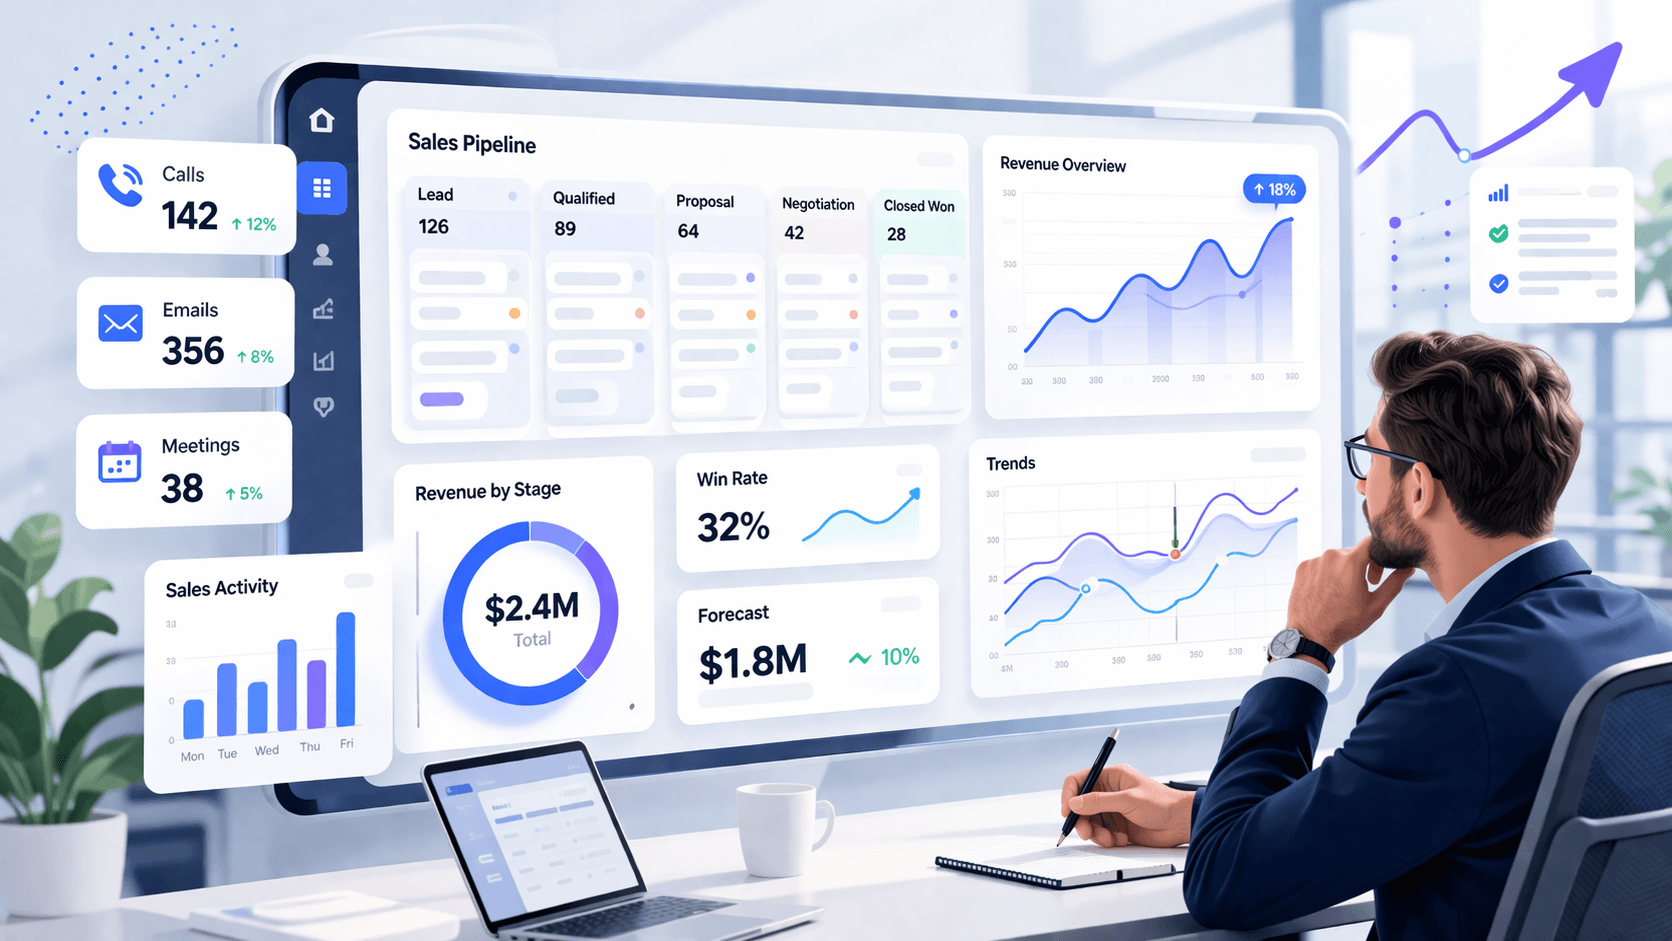
SALES PIPELINE
Sales Report: What It Is, Types, How to Build One, and 4 Free Templates

By Geethapriya
Last updated on May 26, 2026
Explore this blog to understand what a sales report is, which type fits your cadence, how to build one step by step, and get four free downloadable templates you can use immediately.
- What Is a Sales Report?
- Why Most Sales Reports Go Nowhere
- Types of Sales Reports, And When to Use Each
- Key Metrics to Include in a Sales Report
- How to Create a Sales Report: Step by Step
- 4 Sales Report Templates (Free to Download)
- How AI Is Changing Sales Reporting in 2026
- How to Make Sure Your Team Actually Uses Sales Reports
Most sales teams produce reports. Very few act on them. The data gets pulled, shared in a Monday standup, and then everyone moves on with the same instincts they walked in with. That is not a data problem. It is a structural problem.
A sales report is only valuable if it drives a specific decision. This guide covers what a sales report is, the four types your team actually needs, how to build one cleanly, and what to do with it once you have it. Each section also includes a free downloadable template you can use immediately, without rebuilding from scratch.
What Is a Sales Report?
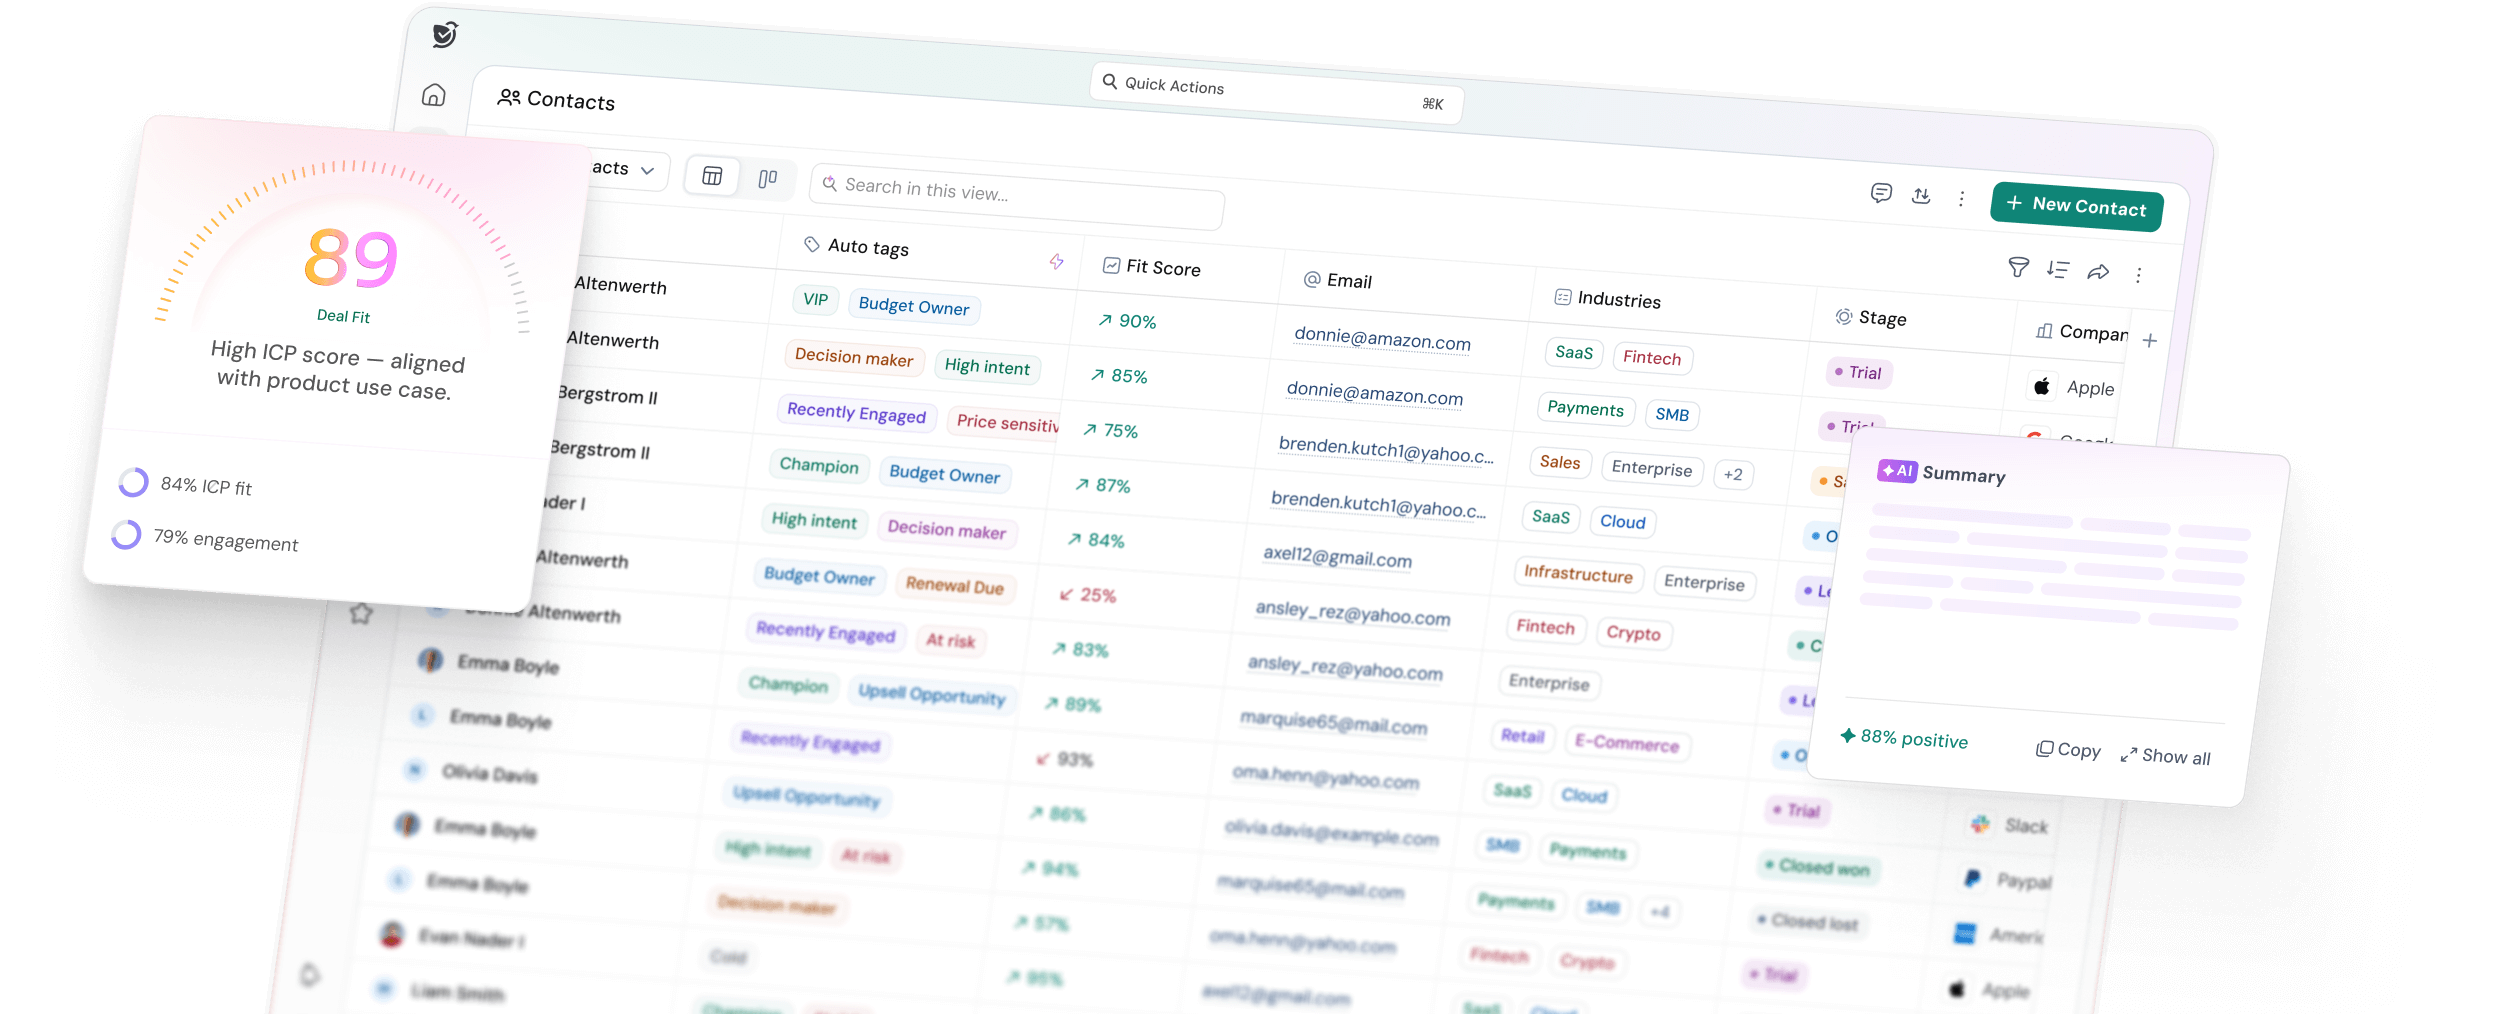
A sales report is a structured summary of sales activity, pipeline health, and revenue performance over a defined time period. It captures what happened, calls made, deals advanced, revenue closed, and compares it against a benchmark, quota, or prior period to surface what needs attention.
Sales reports are distinct from intuition-led updates. They pull from a defined source — your CRM, your outreach tool, your forecasting model- and present the data in a format that makes patterns visible. A rep who says 'I had a good week' is giving you an impression. A sales report tells you whether the numbers support it.
What a sales report typically includes
- Activity data: Calls made, emails sent, meetings held, demos run
- Pipeline data: Deals by stage, deal value, pipeline coverage ratio
- Revenue data: Closed-won revenue, quota attainment, average deal size
- Conversion data: Stage-to-stage conversion rates, win/loss ratios
- Rep or team-level performance: Individual breakdowns against team benchmarks
- Trend comparison: Current period vs. prior period or vs. target
Not every report includes all of these. The best sales reports are scoped to one clear question and answer it completely.
Sales report vs. sales dashboard: the difference that matters
These two are used interchangeably, but they serve different purposes, and confusing them leads to the wrong tool for the wrong question.
Sales Report | Sales Dashboard | |
|---|---|---|
Time orientation | Backward-looking (last week/month / quarter) | Real-time — current state right now |
Primary use | Analysis, accountability, decision-making | Monitoring and awareness |
Format | Structured document or export | Interactive visual — charts, filters |
Who uses it most | Managers, VPs, revenue leaders | Reps, managers, ops teams |
Core question | What happened and why? | Where do things stand right now? |
A dashboard shows you where you are. A report shows you what happened, and forces someone to answer why. Both are necessary. They are not interchangeable.
Why Most Sales Reports Go Nowhere
The issue is rarely bad data. It is good data with no frame. A pipeline report that shows four deals stalled in 'Proposal Sent' has one correct response: someone reviews those deals, understands what stalled them, and takes a specific action this week. If that does not happen, the report failed regardless of how accurate the numbers were.
Well-used sales reports help managers reallocate rep effort before it is too late, identify coaching gaps at the individual level, catch forecast risk before it hits the quarter, and create a shared baseline that removes opinion from team conversations. The discipline is not in producing the report. It is in building the habit of acting on it.
Types of Sales Reports, And When to Use Each
Different cadences answer different questions. Using a monthly report when you need a daily one means you are always a week behind the problem. Here is how to match the report type to the decision you are trying to make.
Report Type | Primary User | Cadence | Core Question It Answers |
|---|---|---|---|
Daily Sales Report | SDRs, BDRs, front-line managers | Every business day | Is the team doing enough top-of-funnel work? |
Weekly Sales Report | AEs, sales managers | Every Monday or Friday | Is the pipeline progressing, and are we on track? |
Monthly Sales Report | VPs, revenue officers, founders | End of each month | Are we trending toward or away from quota? |
Product Sales Report | Sales managers, product, ops | Monthly or quarterly | Which products or tiers are driving revenue? |
Key Metrics to Include in a Sales Report
The metrics in any sales report should map directly to the decision it is designed to support. Add what is relevant. Cut everything else.
Pipeline metrics
Metric | What It Tells You |
|---|---|
Pipeline coverage ratio | How much pipeline exists relative to quota (3x is standard for SaaS) |
Deals by stage | Where volume is concentrated and where bottlenecks are forming |
Average deal age per stage | The extended stage age signals a deal at risk of stalling permanently |
Deals at risk | Opportunities with no activity in 14+ days or past the expected close date |
Pipeline created this period | Net-new deals added — a leading indicator for future revenue |
Activity metrics
Metric | What It Tells You |
|---|---|
Calls made | Top-of-funnel effort volume |
Emails sent / reply rate | Outbound outreach pace and engagement quality |
Meetings booked | Conversion of outreach into qualified conversations |
Demos completed | Mid-funnel throughput |
Follow-up completion rate | Execution discipline, are reps following through? |
Revenue metrics
Metric | What It Tells You |
|---|---|
Closed-won revenue | Actual revenue generated in the period |
Quota attainment % | Individual and team performance against plan |
Average deal size | Trending up or down — signals a shift in deal quality or market fit |
Win rate | Conversion from opportunity to closed-won |
Sales cycle length | Increasing cycle length = friction somewhere in the process |
SparrowCRM reporting without manual effort or exports
For a deeper breakdown of which metrics to prioritise by team size and role, see our guide on sales metrics.
How to Create a Sales Report: Step by Step
Building a useful sales report starts before you open a spreadsheet or your CRM. Start with the question, not the data.
Step 1: Define the purpose and audience
Every report should answer one primary question. 'How is the pipeline?' is not specific enough. 'How much pipeline do we have in the 30-day close window relative to our quota gap?' Identify who will read it and what decision they need to make. A VP of Sales needs different information than a front-line SDR manager. Build for the decision-maker, not for completeness.
Step 2: Match the cadence to the question
Daily reports are for activity tracking. Weekly reports are for pipeline and deal progression. Monthly reports are for revenue trajectory and performance patterns. Do not run a monthly report when the question demands a daily one, the lag kills the usefulness.

Step 3: Pull from one source of truth
Go to your CRM and pull data directly relevant to the question from Step 1. Resist the temptation to add extra columns because the data is available. Every additional metric requires someone to process it. If it does not inform the decision, remove it.
Step 4: Lead with the finding, then the detail
Structure the report so the headline number or conclusion comes first. 'Pipeline coverage is 2.1x against a 3x target — three reps are below 1.5x.' That sentence before the table means the reader does not have to draw their own conclusion from raw numbers. State the finding. Show the data. Name the implication.
Step 5: Distribute with a named next action
A report without a next action is a record, not a management tool. Every report that goes out should include either 'on track, no action required' or a specific, owned next step based on the findings. If there is risk, name it. If someone needs to act, name them.
4 Sales Report Templates (Free to Download)
Below are four sales report templates structured around the most common reporting cadences and use cases. Each one is downloadable via email, no rebuilding from scratch, no generic spreadsheet with thirty columns you will never use.
Each template is built around the exact sections described in this guide. Enter your email to get instant access to the format that matches your cadence.
Template 1: Daily Sales Report
Built for: SDRs, BDRs, front-line managers.
The daily sales report tracks activity output. Its job is not to measure revenue. It confirms that top-of-funnel work is happening at the volume needed to sustain pipeline health. If an SDR's daily numbers drop and no one notices until Friday, you have lost a full week of correction time.
This template covers daily call volume, email volume, meetings booked, and a single notes field for blockers or context. It is deliberately narrow, one page, five minutes to complete, one decision it enables: are we doing enough today to hit the number next month?
Section | What to Fill In |
|---|---|
Date | DD/MM/YYYY |
Rep Name | The individual completing the report |
Calls Made | Actual vs. daily target |
Emails Sent | Actual vs. daily target |
LinkedIn / Social Touches | Optional — if part of your sequence |
Meetings Booked Today | Number of qualified meetings scheduled |
Demos / Discovery Calls Completed | If applicable |
Pipeline Created (new deals) | Deal name + estimated value if created today |
Blockers / Notes | One sentence — anything that reduced activity today |
Manager Sign-Off | Optional — useful for team accountability reviews |
Daily Sales Report Template - Free to Download
Template 2: Weekly Sales Report
Built for: AEs, sales managers, SDR team leads.
The weekly sales report is where activity and pipeline intersect. It is the most commonly used cadence and the one most likely to drive immediate tactical decisions. A well-structured weekly report shows what happened in the last seven days, what is expected to move in the next seven, and where attention needs to go before next week's call.
This template is built around five sections: activity summary, pipeline health, deals expected to close in the next two weeks, key risks, and named actions. The action section is the one most teams skip. It is the most important one.
Section | What to Fill In |
|---|---|
Period | Week of [Date] — [Date] |
Headline Summary | One sentence: on track / ahead / behind — and why |
Activity This Week | Calls, emails, meetings, demos — actual vs. weekly targets |
Deals Created This Week | New opportunities added to pipeline — name, value, owner |
Deals Advanced This Week | Deals that moved to a later stage — name, from stage, to stage |
Deals Stalled / At Risk | No activity in 7+ days or past expected close — name, owner, risk |
Deals Expected to Close (Next 14 Days) | Deal name, owner, value, stage, confidence level |
Pipeline Coverage Ratio | Total pipeline value ÷ remaining quota target |
Key Risks | Specific deals or patterns that need attention this week |
Action Items | Named actions with owners — not observations, not takeaways |
Weekly Sales Report Template - Free to Download
Template 3: Monthly Sales Report
Built for: VPs of Sales, revenue officers, and founders.
The monthly sales report steps back from the tactical to assess the trajectory. It answers whether the team is trending toward or away from the quarterly quota, where conversion is breaking down across the pipeline, and whether individual rep performance is consistent with the plan.
The section most teams skip in their monthly report is the narrative — 'What changed and why.' Numbers without context are data. Numbers with a clear explanation of what drove them are insightful. This template forces that section because it is where the real value lives.
Section | What to Fill In |
|---|---|
Period | Month of [Month, Year] |
Revenue Summary | Closed-won vs. target, quota attainment % for the month |
Pipeline Health | Coverage ratio, pipeline by stage, pipeline created vs. prior month |
Conversion Analysis | Win rate, average deal size, average cycle length vs. prior period |
Rep Performance Breakdown | Individual quota attainment, activity volume, deals in pipe per rep |
Deals Won This Month | Deal name, rep, value, industry, notes on what drove the win |
Deals Lost This Month | Deal name, rep, value, loss reason, competitive notes |
Forecast (Next 30–60 Days) | Committed deals + likely deals + weighted pipeline total |
What Changed and Why | One paragraph of narrative — what drove the results this month |
Actions for Next Month | Specific, owned next steps based on findings — not general goals |
For how to build and read forward-looking projections from your pipeline, see our guide on sales forecasting.
Monthly Sales Report Template - Free to download
Template 4: Product Sales Report
Built for: Sales managers, revenue ops, product, and GTM teams.
A product sales report breaks down revenue and pipeline performance by product line, pricing tier, or SKU. It answers a different question from the other three: not how much we are selling, but what we are selling — and what the mix tells us about our positioning, our customers, and our growth strategy.
This report type is particularly important for companies with multiple plans, add-ons, or products. A team hitting overall quota but closing almost entirely on the lowest tier has a different problem than one with a healthy mix across tiers. The product sales report makes that visible before it becomes a revenue ceiling.
Section | What to Fill In |
|---|---|
Period | Month of [Month, Year] or Quarter of [Q, Year] |
Revenue by Product / Tier | Total closed-won revenue broken down by each product or plan |
Units Sold by Product | Number of deals closed per product line |
Average Deal Size by Product | Revenue ÷ deals closed, per product |
Pipeline by Product | Active pipeline value broken down by product or plan |
Win Rate by Product | Deals won ÷ total opportunities, per product |
Top-Performing Segments | Which ICP segments or verticals closed most by product |
Cross-sell / Upsell Activity | Expansion deals, existing customers who added a product or upgraded |
Products with Declining Pipeline | Any product line with a pipeline less than the prior period, flag and note why |
Product Mix vs. Target | Actual mix vs. intended mix and what the gap means for the next period |
Actions | Named next steps: pricing, positioning, rep training, product feedback |
Product Sales Report Template - Free to Download
How AI Is Changing Sales Reporting in 2026
The traditional sales reporting workflow: a manager exports data from the CRM on Friday afternoon, pastes it into a spreadsheet, formats it, and sends it out before the end of the day. It takes 45 to 90 minutes. The data is already stale when it lands.
AI-native CRMs are changing this. Instead of generating reports on a schedule, they surface insights continuously, flagging when a deal goes quiet, when pipeline coverage drops below threshold, or when a rep's activity falls below their own baseline. The report becomes less of a weekly artifact and more of an always-on signal layer.
If you want to skip manual data-pulling entirely, SparrowCRM, an AI-native CRM, auto-generates pipeline reports, activity summaries, and deal-level insights directly from live CRM data. Your reports are always current, without anyone exporting a spreadsheet on Friday afternoon.
This matters because the value of a report is time-sensitive. A pipeline risk flagged on Friday is useful. The same risk flagged on Tuesday, when there is still time to act, is significantly more useful. AI reporting does not replace the need to understand your numbers. It removes the lag between when the risk appears and when someone knows about it.
How to Make Sure Your Team Actually Uses Sales Reports
The biggest failure mode in sales reporting is not bad data. It is good data that nobody acts on. Here is what separates reporting cultures that work from ones that do not.
Tie every report to one specific decision
When a report goes out, include one question it is designed to answer. 'This week's pipeline report tells us whether we need to reallocate outreach for the close period.' When people know what they are looking for, they engage with the data rather than skimming it.
Make the action explicit in the report itself
A report is incomplete without a stated next step. Even if the finding is neutral, 'pipeline looks healthy, no action required,' say it explicitly. When there is risk, name the action and name the owner. 'Three deals in the 30-day window have had no activity. [Name] will review all three by Wednesday.' That one sentence makes the report worth reading.
Keep the format consistent every time
The first time someone receives a report in a new format, they spend energy figuring out how to read it rather than what it says. Use a consistent template every week and every month. Consistency makes reports faster to produce and easier to consume. The four templates in this blog are designed for exactly that purpose.
Review in the meeting, not before it
The most effective sales teams do not send reports as pre-reads and then move on. They spend five minutes in the weekly meeting walking through key findings together. This ensures the data lands, generates shared accountability, and gives the manager visibility into whether the team has the same read on the numbers as leadership does.
For a broader view of how reporting sits within your CRM data infrastructure, see our guide on CRM reporting and analytics.