SALES PIPELINE
CRM reporting and analytics: What it is, reports, metrics & examples

By Geethapriya
Last updated on Aug 24, 2026
Explore this blog to understand which CRM reports your sales team should run, how to read the data inside them, and how to turn each report into a clear decision.

Geethapriya
Updated on Aug 24, 2026
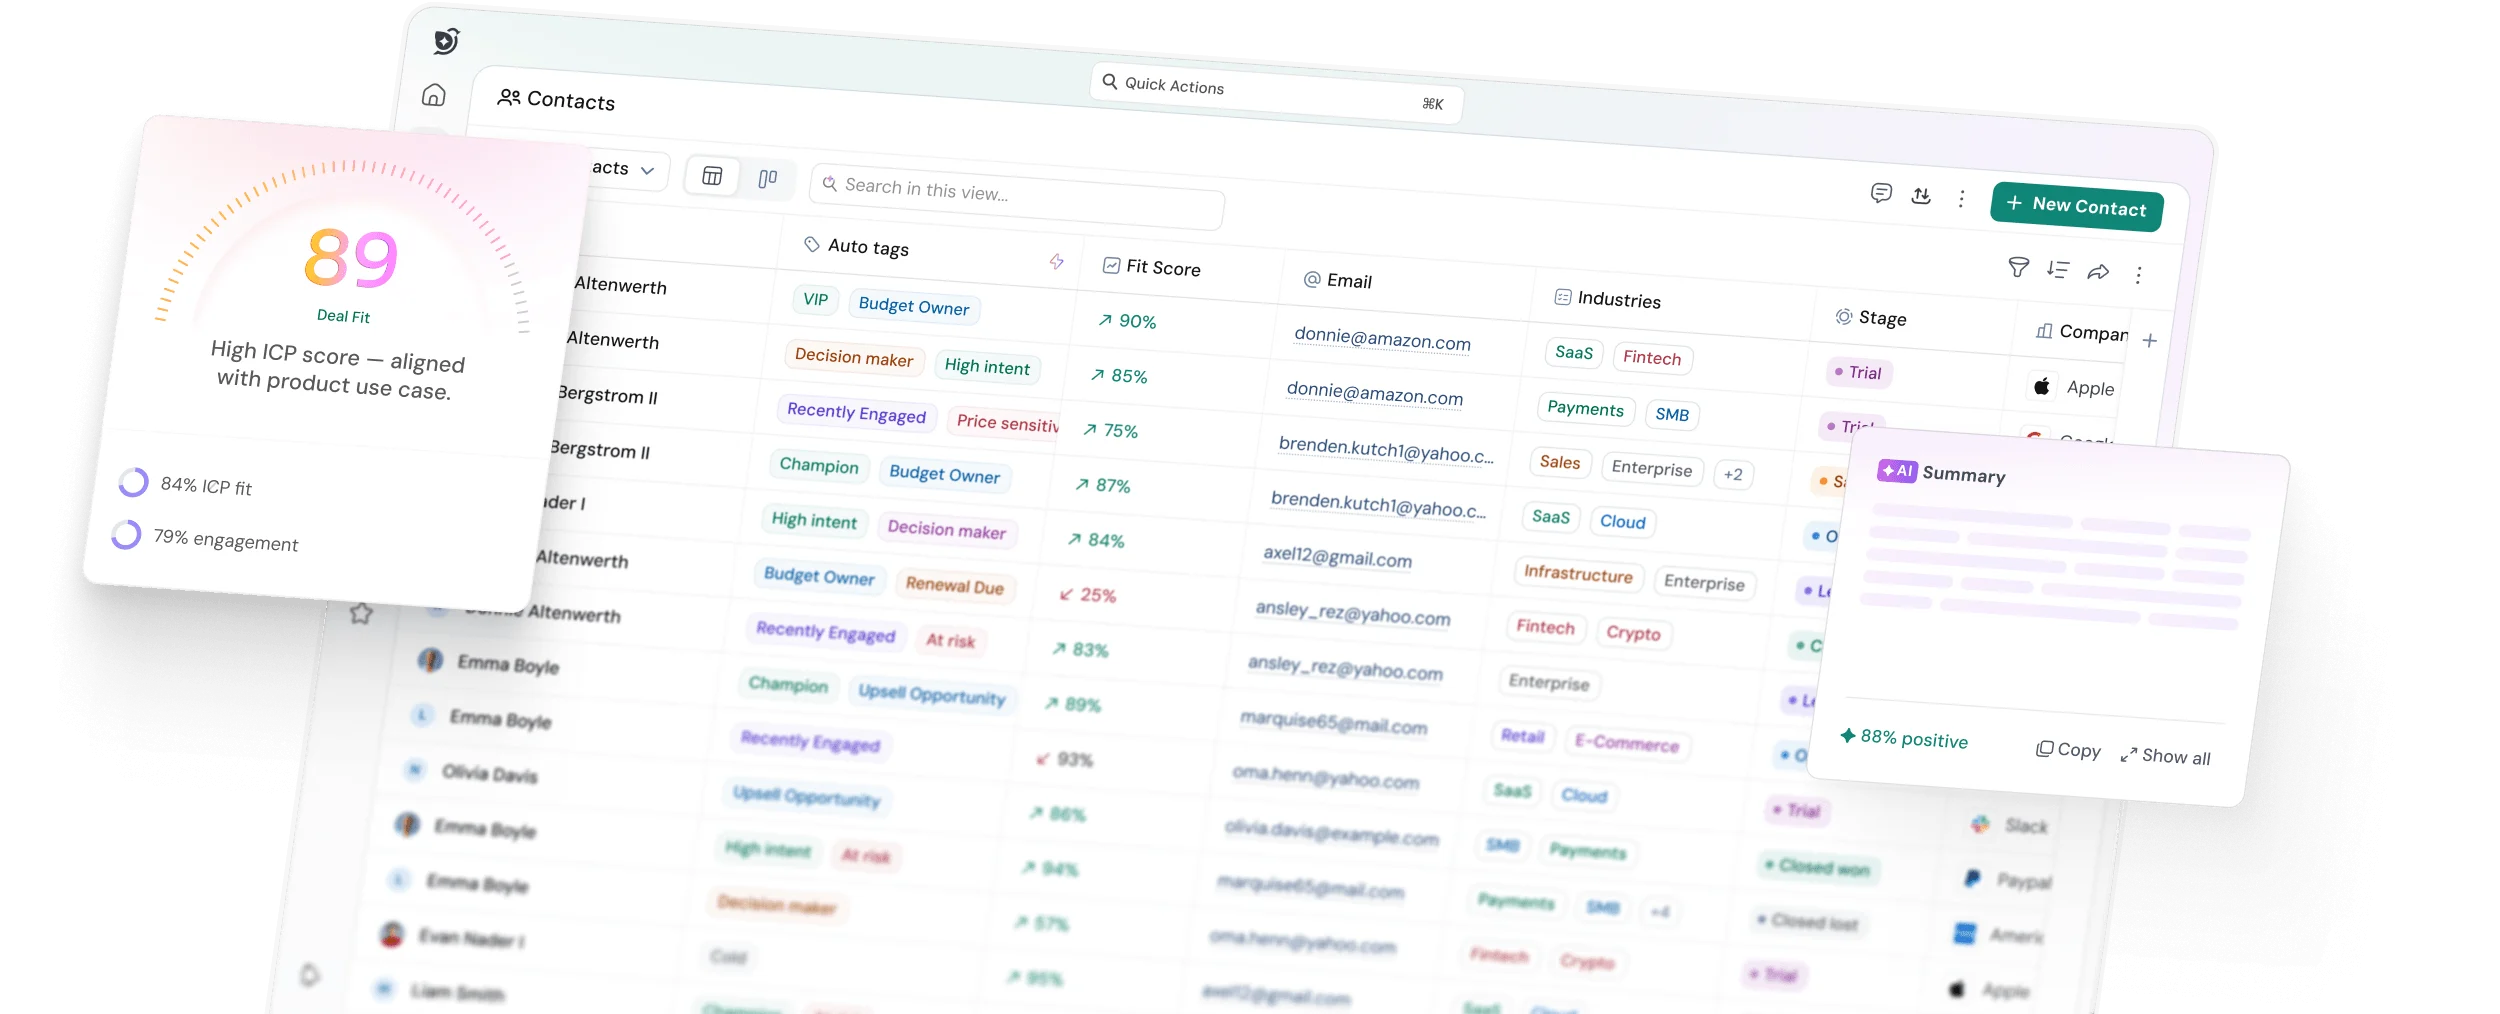
Your CRM stores more customer and sales data than your team has ever tracked before. But data sitting in a database isn't the same as insight. That’s where CRM reporting and analytics come in. It helps your team turn raw CRM data into useful insights, from spotting trends and identifying risks to making better decisions before opportunities are lost.
One of the biggest differences between sales teams that consistently hit quota and those that don't is how they use their CRM data. Success isn't just about making more calls or sending more emails. It's about spotting trends, identifying risks, and acting on the right information before opportunities are lost.
In this guide, you'll learn which CRM reports matter most, how to interpret what they reveal, and how to build a reporting routine your team will actually follow. If you're still exploring whether a CRM is right for your business, start with our complete CRM software guide, then come back to this article.
TL;DR
What is CRM reporting and analytics?
CRM reporting and analytics is the process of collecting, organizing, and analyzing data stored in a CRM to understand sales performance, pipeline health, customer activity, and revenue trends. CRM reporting shows what happened, while CRM analytics helps explain why it happened and what to do next.
What is a CRM report?
A CRM report is the output of CRM reporting. It's a filtered, structured view of your CRM data that answers one question at a time.
For example, a report might show how many leads were contacted this week, which deals haven't moved in 14 days, or the revenue expected to close this month. Reports can be viewed on demand or scheduled for regular delivery, and their accuracy depends on the quality of the data entered into your CRM.
What is CRM analytics?
CRM reporting tells you what happened. CRM analytics helps you understand why it happened.
For example, a report might show that your win rate dropped from 28% to 19% over the last three months. CRM analytics goes a step further by identifying patterns behind the decline, such as a specific lead source, a sales pipeline stage where deals are stalling, or performance differences between reps. It turns reports into actionable insights that help sales teams make better decisions.
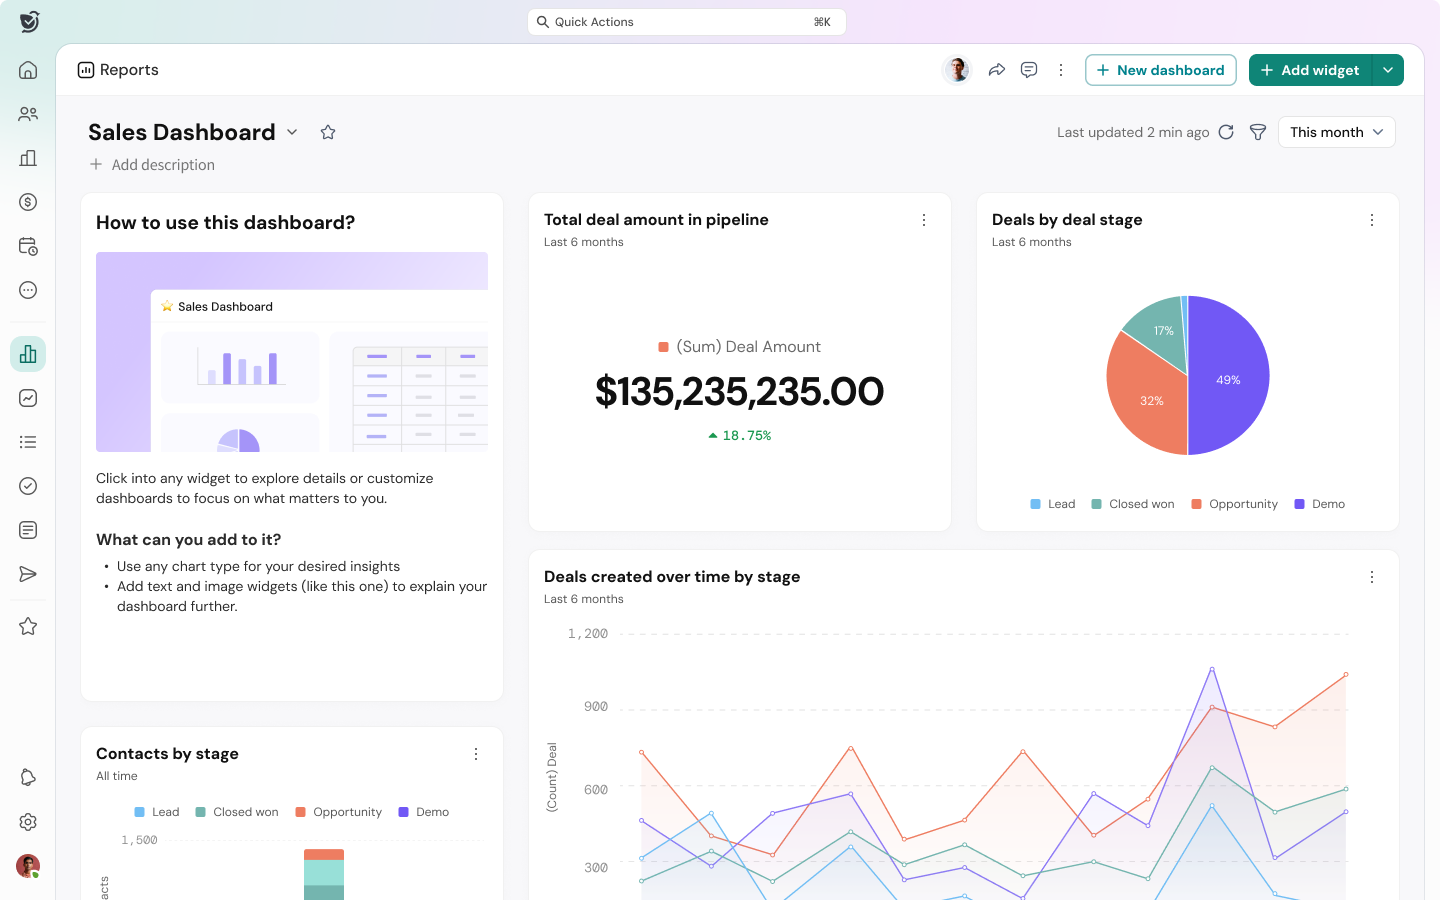
CRM report vs. CRM dashboard: The difference that matters
This is one of the most common points of confusion in CRM usage, and it matters because using the wrong one for the wrong purpose wastes time and leads to decisions made on incomplete information.
CRM Report | CRM Dashboard | |
|---|---|---|
What it is | A detailed, filtered data output for a specific question | A visual summary of multiple metrics in one view |
Best for | Deep dives, audits, and post-period analysis | Real-time monitoring, daily check-ins |
Time dimension | Covers a defined period (last week, last quarter) | Usually live or near-live |
Audience | Managers, analysts, and leadership are reviewing performance | Reps and managers are doing daily monitoring |
Depth | High shows individual records, totals, and breakdowns | Low to medium shows summary numbers and trends |
Example | "Show me all deals lost in Q1 by stage and rep." | "How is the team tracking toward quota right now?" |
When to use each?
Use a CRM report when you need to answer a specific question in full detail, a weekly pipeline review, a post-quarter win/loss analysis, or a rep performance audit. Use a dashboard when you need a live read on team activity or a high-level view before a leadership meeting.
The mistake most teams make is building dashboards and calling them reporting. Dashboards show you the score. Reports tell you how you got there and what to do next.
Types of CRM reports: 5 essential reports to track
These are not optional. They are the minimum set a sales team needs to manage pipeline, coach reps, and forecast revenue with any reliability. For a broader look at report formats and templates, see the guide on sales reports.
1. Sales activity report
This report shows what your reps are actually doing: calls made, emails sent, meetings booked, tasks completed. It is the ground-level input that every other metric depends on.
A rep with a collapsing win rate but strong activity has a skill or process problem. A rep with dropping activity has a capacity or motivation problem. The activity report tells you which conversation to have.
Example: An SDR sees their conversion rate drop from 18% to 11% in two weeks. The activity report shows call volume is unchanged, but email reply rates have fallen to zero. The new email template is not working. One report, one clear fix.
2. Pipeline report
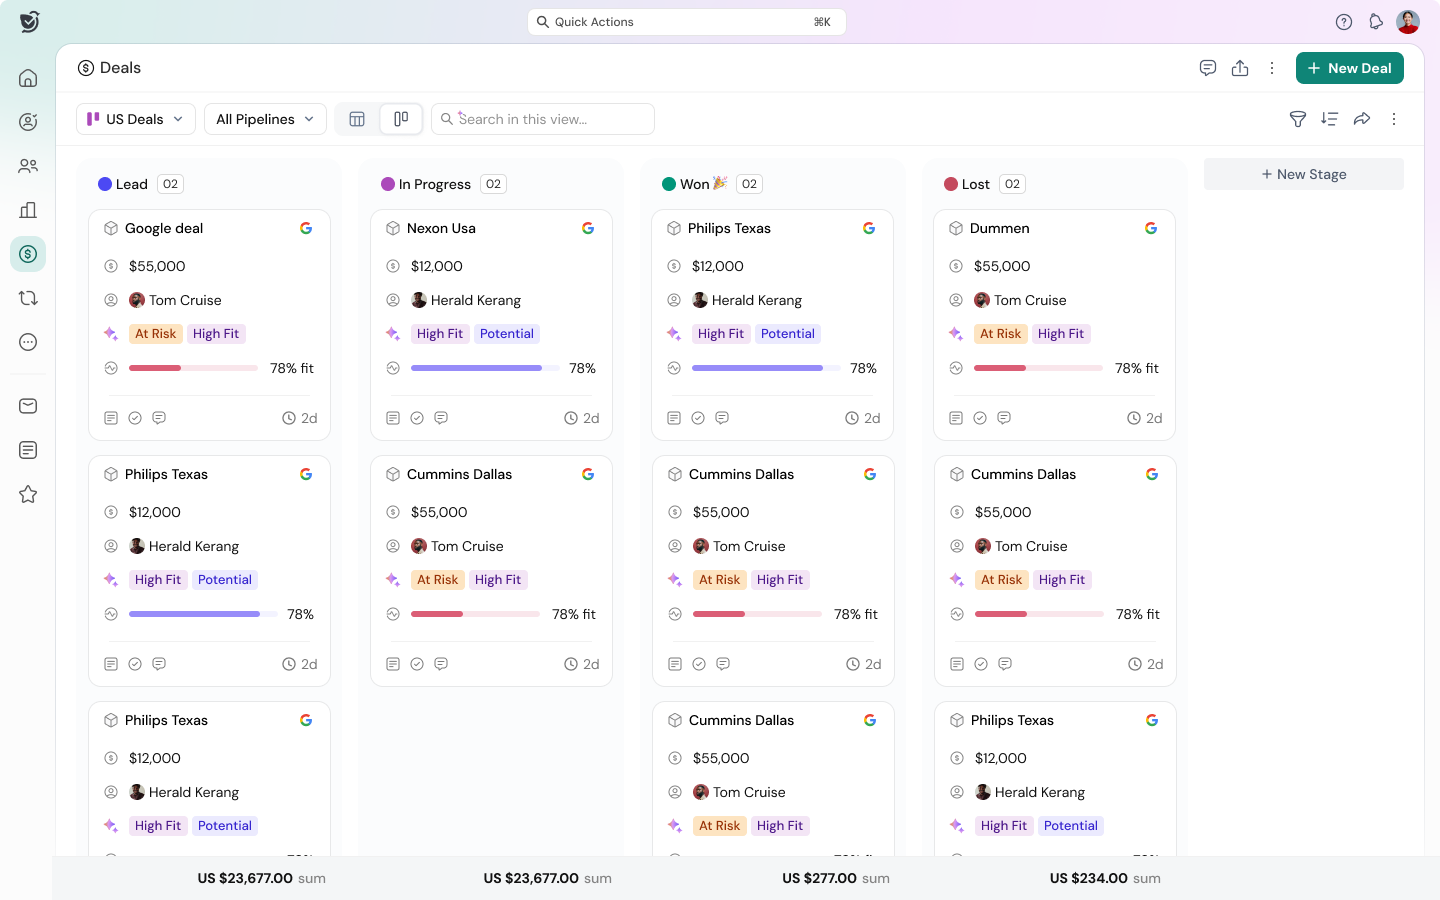
The pipeline report is the most important report a VP of Sales should open every Monday morning. It shows all open deals by stage, value, rep, and expected close date.
Look for: deals that have not moved stages in 14 days or more, close dates in the past that have not been updated, and stages with higher-than-average drop-off rates.
Example: A VP of Sales sees $120,000 sitting in Proposal Sent with no activity in 18 days. She reallocates two reps to those accounts before the quarter ends. That is the decision this report is designed to drive.
3. Deal conversion report
This report tracks what percentage of deals advance from each stage to the next. It is the most precise diagnostic tool for identifying where your funnel leaks.
If 70% of deals advance from Qualified to Demo, but only 30% advance from Demo to Proposal, that stage needs attention. Better demo scripts, clearer next steps, faster follow-up.

4. Revenue and forecast report
This report compares your revenue forecast against actual closed revenue. The key number to track is forecast variance, the percentage difference between what your team predicted and what actually closed. For methods and frameworks, see our sales forecasting guide.
Research shows that 9 out of 10 sales organizations miss their forecasts by more than 5%. That gap affects budgeting, hiring, and growth plans.

Pipeline Coverage Ratio: Total pipeline value / Revenue target. A 3:1 ratio is a healthy buffer for most SaaS businesses.
5. Rep performance report
This report tracks individual rep performance against quota, activity targets, and conversion benchmarks. It surfaces top performers and gives managers objective data for 1:1 conversations.
Track: closed revenue vs. quota, win rate, average deal size, sales cycle length, and forecast accuracy per rep. A rep who over-forecasts by 30% is a different coaching conversation from one who is accurate but slow to close.
Key CRM metrics to track (by category)
Every CRM reporting and analytics is built on metrics. Here is a practical breakdown organized by the three areas that matter most for a sales team.
Pipeline metrics
Metric | What It Measures | Benchmark (SaaS) |
|---|---|---|
Pipeline Coverage Ratio | Total pipeline value / Revenue target | 3:1 healthy; 5:1 strong |
Sales Velocity | (Opportunities x Avg Deal Value x Win Rate) / Sales Cycle Length | Higher = faster revenue |
Stale Opportunities | Deals with no stage movement in 14-30 days | Should be under 10% of the pipeline |
Lead-to-Opportunity Rate | Qualified leads / Total leads x 100 | 10-15% average B2B; 20%+ strong |
Activity metrics
Metric | What it measures | Why it matters |
|---|---|---|
Calls Made per Rep | Volume of outbound calls per rep per week | Leading indicator of pipeline generation |
Email Reply Rate | Replies received / Emails sent x 100 | Shows messaging effectiveness |
Lead Response Time | Time from lead creation to first contact | Leads contacted in 5 min are 9x more likely to convert |
Activity Logging Rate | % of interactions recorded in CRM | Data completeness — affects all other reporting |
Revenue metrics
Metric | What it measures | Benchmark |
|---|---|---|
Win Rate | Closed-won / Total opportunities x 100 | Average B2B: 20-30% |
Average Deal Size | Total revenue / Number of deals closed | Varies by segment and product |
Forecast Variance | ((Actual - Forecast) / Actual) x 100 | Under 10% variance = reliable forecast |
Customer Lifetime Value | Avg revenue per customer x Lifespan - Cost to serve | CLV: CAC ratio of 3:1 is healthy |
Customer Churn Rate | Customers lost / Total customers at start x 100 | Early SaaS: ~6.5%/mo; Enterprise: ~3.1%/mo |
What good CRM reporting looks like in practice
The gap between teams that use CRM reporting well and those that do not is rarely about access to data. It is about whether the report leads to a decision.
Scenario 1: Monday pipeline review
A VP of Sales at a 20-person SaaS company opens the pipeline report every Monday at 8 am. She filters for deals due to close within 30 days, sorted by value. This week, the top three deals totaling $180,000 all have close dates in 10 days, but no activity has been logged in the past week. She asks both AEs for an update by 10 am. By midday, she has a clear read on which deals are real and which need to be pushed. The pipeline report takes 12 minutes. The decision saves the quarter.
Scenario 2: Win/loss analysis
A sales manager pulls a three-month win/loss report filtered by deal source. The data shows that inbound leads from the company blog close at a 34% win rate. Outbound cold email closes at 9%. She presents the data to the marketing team the next day. Content investment goes up. Cold outreach volume goes down. The report didn't make the decision, but it made it obvious.
Scenario 3: Rep coaching
A manager runs a rep performance report before a 1:1. She sees that one rep has a strong win rate (31%) but an average deal size 40% below the team average. She is closing too many small deals and not qualifying hard enough on deal size. One number. One coaching focus for the next month.
How does AI-powered reporting work in SparrowCRM?
SparrowCRM layers AI analytics directly onto the deal and contact level, so reporting becomes an active system rather than a passive one.
- Deal Score: Each deal carries a live score that updates after every interaction. Drop in score = automatic flag in the pipeline view.
- Risk Factors: SparrowCRM surfaces specific reasons a deal is at risk: no decision-maker contact, competitor mention detected, stalled stage, before you pull a report.
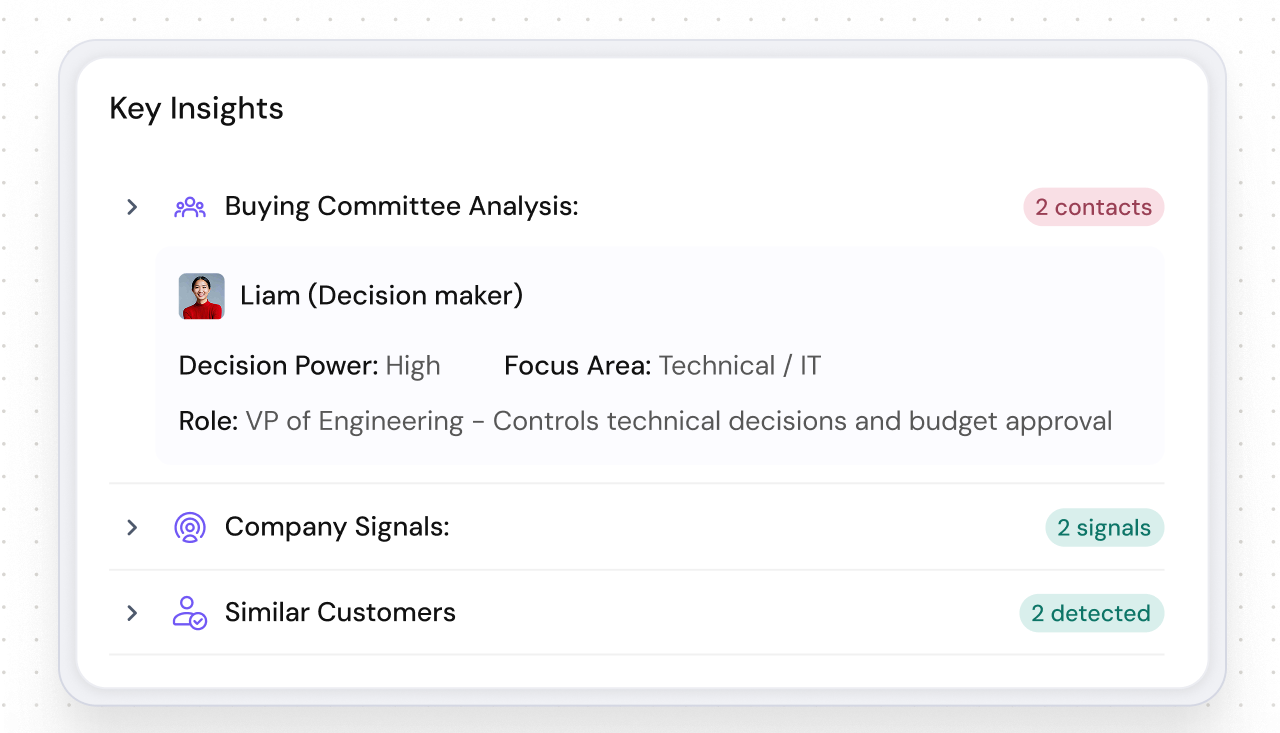
- Buying Intent Score: AI tracks engagement signals from emails, calls, and website activity to show which leads are warming up and which are going cold.
- AI Next Actions: After each interaction, SparrowCRM generates a recommended next action per deal so reps do not have to decide what to do; they just execute.
- Deal Loss Analysis: When a deal closes as lost, SparrowCRM logs the reason and surfaces patterns across lost deals, common objections, competitor mentions, and the stage where the deal died.
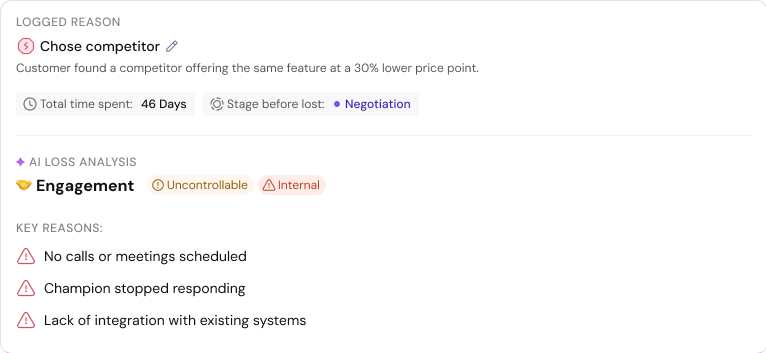
This is the difference between a CRM as a record-keeping system and a CRM as a revenue intelligence layer. For more on how dashboards surface these AI signals in real time, see our guide to CRM dashboards.
Build 5 custom CRM reports for free

How to build a CRM reporting habit that actually sticks?
Most CRM reporting fails not because the reports are wrong, but because there is no habit around acting on them. A report no one reads is just data.
Set a fixed cadence
Cadence | Report to run | Decision it drives |
|---|---|---|
Daily | Activity report | Which reps need a nudge today? |
Weekly | Pipeline report | Which deals need attention before the week ends? |
Weekly | Rep performance snapshot | Who needs coaching? Who is on track? |
Monthly | Revenue vs. forecast report | Are we on track to hit the number? What needs to change? |
Quarterly | Win/loss analysis | Which deal sources, lead types, and reps are driving results? |
Start with the decision, not the data
Every report should answer one question. Before you build or run a report, write down the question it needs to answer. If you cannot name it, the report will not be useful.
For how to structure and present your report findings, see the guide on sales reports.
Make data entry non-negotiable
Your reports are only as accurate as the data in your CRM. The most common reason CRM reporting fails is not poor tooling; it is inconsistent data entry. Every call, email, and meeting needs to be logged.
The easiest fix: choose a CRM that logs activity automatically rather than depending on reps to do it manually. When data capture happens at the system level, report accuracy goes up without requiring behavior change from the team.
Close every review with a next action
A report without a next action is just a record. Every reporting session, whether a daily activity check or a monthly revenue review, should end with at least one named action, one owner, and one deadline. That is what turns a CRM report into a management tool.

Geethapriya
Geethapriya is a Growth Marketer and Business Researcher who researches and writes about CRM, sales, marketing, and customer engagement. Her work focuses on understanding industry trends, customer and sales challenges, and how businesses can use technology to build more effective growth processes.
Frequently Asked Questions (FAQs)
Related Articles

18 Aug, 2025
CRM Dashboard: The Complete Guide to KPIs, Examples & Setup

29 Apr, 2025
CRM for remote sales teams: 8 features that actually move deals forward

02 Apr, 2026