SALES STRATEGY
TAM, SAM & SOM explained: what they mean and how to use them

By Ganesh Ravi Shankar
Last updated on Jun 16, 2026
Explore this blog to understand how TAM, SAM, and SOM define your actual market opportunity, and how to calculate each one without the guesswork.

- Key takeaways
- What is TAM (total addressable market)?
- What is SAM (serviceable addressable market)?
- What is SOM (serviceable obtainable market)?
- TAM vs SAM vs SOM: understanding the differences
- When to use each metric
- Why TAM SAM SOM matters for your business
- How to calculate TAM, SAM, and SOM
- Real-world examples of TAM, SAM, and SOM
- Common mistakes to avoid when calculating TAM, SAM, and SOM
- Final thoughts
Most founders and sales leaders know the feeling: someone asks how big your market is, and you reach for the biggest number you can defend. A billion-dollar TAM sounds impressive in a pitch. But experienced investors and experienced operators know that market size is only useful when it connects to execution.
TAM, SAM, and SOM are the three numbers that turn a vague market claim into a structured argument. They tell you where growth is theoretically possible, what you can actually serve, and what revenue you can realistically win in the near term. Each metric does a different job, and getting them confused is one of the fastest ways to lose credibility in a boardroom or a pipeline review.
This guide breaks down all three, what they mean, how to calculate them, where they get misused, and how to build a market sizing model grounded in real data rather than wishful thinking.
Key takeaways
- TAM shows maximum potential, SAM defines what you can serve, and SOM reveals what you can realistically capture. Each metric serves a distinct purpose in business planning.
- Use bottom-up calculations with real data over top-down estimates, ground your market sizing in actual customer behaviour, pricing, and sales metrics.
- SOM should reflect operational constraints, not wishful percentages, factor in sales capacity, competitive pressure, and execution limits.
- Update market sizing regularly, markets shift due to competition, regulation, and changing buyer behaviour, requiring at least annual reassessment.
- Avoid arbitrary small-percentage claims; picking a "0.5% of the market" SOM without supporting logic is not a forecast, it's a guess.
.png?2026-06-16T04:21:24.401Z)
What is TAM (total addressable market)?
Total addressable market (TAM) represents the full revenue opportunity for a product or service, assuming 100% market share with no competition and no constraints. It is the ceiling, the maximum possible revenue if every potential buyer in the world became your customer.
TAM is most useful as a signal, not a target. It helps you decide whether an opportunity is large enough to be worth pursuing, compare different market bets, and establish a credible starting point for investor conversations. Investors typically expect a five-year revenue goal to be no more than 5–10% of TAM. If your TAM is too small relative to your ambitions, the math doesn't hold.
You can express TAM in two ways: as total revenue potential (Average Revenue Per User × total potential customers) or as total customer count. Revenue-based TAM is more common in B2B contexts because it connects directly to financial projections.
What is SAM (serviceable addressable market)?
; is the slice of TAM that your business can realistically reach given your current product, distribution model, geography, pricing, and customer profile. It narrows the universe down to the buyers who could actually buy from you today.
The most common mistake with SAM is treating it as purely a geographic filter: "We'll focus on the US, so we'll take 4% of the global TAM." That is not SAM. SAM accounts for product fit, market maturity, regulatory environment, sales cycle compatibility, and whether your offer matches what buyers in a given segment actually need.
A product can have nearly identical TAM figures in two countries and a wildly different SAM in each one. The SAM is where your go-to-market strategy lives; it defines who to target, where to invest, and which customer segments to deprioritise.
What is SOM (serviceable obtainable market)?
Serviceable obtainable market (SOM) is the share of SAM your business can realistically capture within a defined timeframe, given competition, operational capacity, and commercial constraints. It is the number that should anchor your revenue forecasts.
SOM stops being credible the moment it disconnects from operational reality. A well-built SOM considers how many salespeople you can hire and ramp, what your current conversion rates look like, how long deals take to close, and where pipeline historically stalls. A round number like "$10M" signals guesswork. A specific number like "$9.4M" signals that someone ran the bottom-up calculation.
The formula is straightforward: divide last year's revenue by last year's SAM to get your current market share percentage, then apply that percentage to this year's SAM. Adjust upward only when you have concrete plans that justify it, such as new hires, new channels, or expanded product coverage.
TAM vs SAM vs SOM: understanding the differences
Metric | Scope | Focus | Primary use case |
|---|---|---|---|
TAM | Broad, theoretical | Maximum revenue potential with no constraints | Proving market size to investors; evaluating whether an opportunity is worth pursuing |
SAM | Realistic and product-bounded | What your business can serve today | Go-to-market planning; ICP definition; marketing budget allocation |
SOM | Operationally grounded | What you can win, given the competition and capacity | Revenue forecasting, sales hiring, pipeline planning |
How TAM differs from SAM
TAM assumes a frictionless market where you serve every potential buyer. SAM applies the reality check: your product only solves certain problems well, your pricing excludes some segments, and your sales motion only works in certain contexts. These constraints are not weaknesses; they are the inputs that make your SAM number credible and defensible.
Companies that conflate TAM with SAM tend to overestimate near-term opportunity while underestimating execution friction. Winning 3% of your SAM is a better outcome than winning 0.1% of your TAM, but only the former reflects what is actually achievable.
How SAM differs from SOM
SAM defines the market you are qualified to compete in. SOM defines the share you can realistically take, given who else is competing for it. Two companies with identical SAMs can have dramatically different SOMs depending on their sales capacity, brand awareness, pricing, and go-to-market efficiency.
SOM is often the number that requires the most discipline to calculate honestly. It is also the number that matters most when setting revenue targets, hiring plans, and board-level expectations.
When to use each metric
When to use TAM
Use TAM to evaluate whether a market opportunity justifies investment, to pitch investors who need to understand the scale of the problem you are solving, and to compare two or more strategic bets. TAM is also useful when entering a new category or geography; it tells you whether the ceiling is high enough to matter.
If you are projecting $50M ARR in five years, investors will expect to see a TAM of at least $500M. A TAM smaller than 10–20x your revenue goal raises questions about how much headroom you actually have.
When to use SAM
Use SAM when building your go-to-market strategy, defining your ideal customer profile, deciding which regions or verticals to enter first, and allocating marketing budget across segments. SAM is the market where your pipeline comes from; it defines who you should be talking to.
SAM is also the right number to use when presenting product roadmap priorities to leadership. Features that expand your SAM, by making the product fit more segments, are often more valuable than features that improve conversion within existing accounts.
When to use SOM
Use SOM when setting quarterly and annual revenue targets, planning sales team headcount, forecasting pipeline requirements, and allocating resources across campaigns. SOM is where your commercial plan lives. Every number downstream of it, quota, OTE, and marketing spend, should trace back to a credible SOM calculation.
SOM is also the right metric for board updates and investor progress reports. Tracking actual revenue as a percentage of SOM over time tells a clear story about execution efficiency and market penetration.
Why TAM SAM SOM matters for your business
Setting realistic revenue goals
Without a properly calculated SOM, revenue goals are either too aggressive (burning out the sales team chasing impossible numbers) or too conservative (leaving growth on the table). A grounded SOM anchors the entire planning process, headcount, pipeline coverage, and marketing spend to something defensible.
Building your marketing strategy around TAM means targeting everyone. That spreads resources thin and produces poor conversion. SOM tells you who to target first, and how much revenue you can expect to generate from that focused effort in a given period.
Attracting investors with market data
Sophisticated investors do not accept vague market size claims. They want to see the calculation, challenge the assumptions, and stress-test the SOM. A pitch that presents a TAM without a credible path to SOM looks like a guess. A pitch that shows bottom-up SAM and operationally grounded SOM looks like a business.
Well-researched market sizing also demonstrates that the leadership team understands the competitive landscape, the buyer profile, and the sales motion, three things investors care about deeply before committing capital.
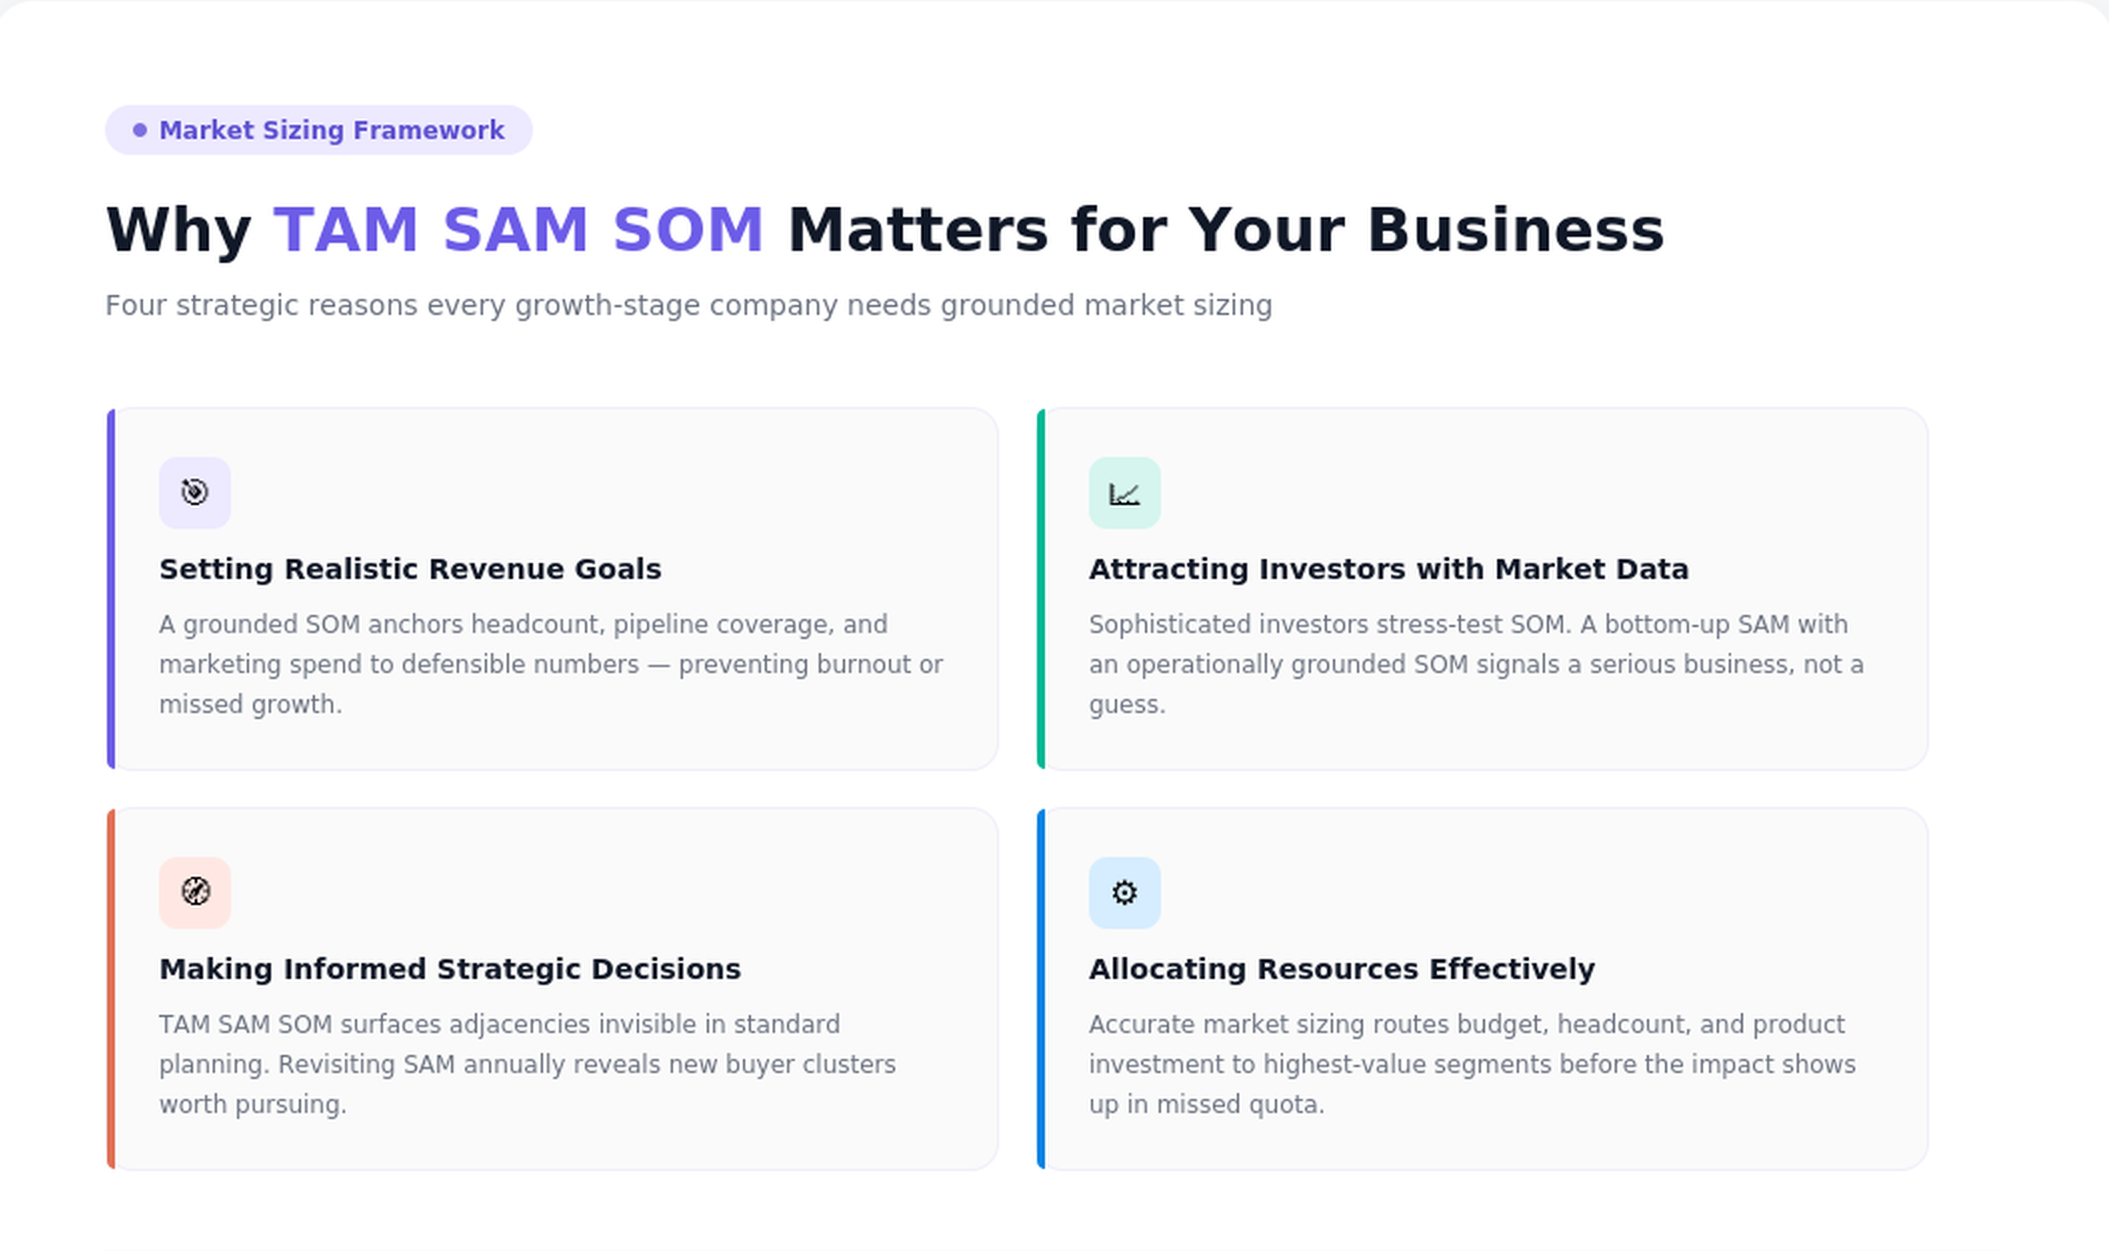
Making informed strategic decisions
TAM SAM SOM analysis surfaces opportunities that are not obvious from standard planning. A company might discover it is deeply penetrating a narrow SAM while barely touching adjacent segments where the product fits equally well. Revisiting the SAM calculation annually often reveals new clusters of addressable buyers.
These metrics also help validate new product ideas. Before building a feature for a new segment, calculating whether that segment materially expands SAM provides a clear answer to whether the investment is justified.
Allocating resources effectively
Accurate market sizing allows you to allocate budget, headcount, and product investment to the segments that will produce the highest return. Without a clear SAM and SOM, resource allocation defaults to gut feel and gut feel tends to favour the loudest voices in the room, not the highest-value opportunities.
Regular reassessment also keeps allocation aligned to market conditions. A segment that represented 40% of SAM eighteen months ago might have contracted due to competitive pressure or regulation. Knowing that early means you can reallocate before the impact shows up in missed quota.
How to calculate TAM, SAM, and SOM
Top-down vs bottom-up approach
The top-down method starts with a broad industry figure from analyst reports or market research, then applies filters to estimate what portion your business could address. It is fast and useful when you have limited sales data, typically at the earliest stages of a new product or market entry.
The bottom-up method starts from actual customer data: average contract value, number of qualifying companies, win rates, and sales capacity. It builds up to a total rather than filtering down from one. Bottom-up calculations take more time but produce far more credible and defensible numbers, which is why experienced operators and investors prefer them.
TAM calculation
Example: A SaaS company targeting mid-market US manufacturing firms identifies 600,000 qualifying businesses and charges $10,000 ACV. TAM = $6 billion.
Using a top-down approach for the same company, an industry report cites the US manufacturing software market at $6.5 billion. That becomes the TAM starting point, though bottom-up validation is recommended before relying on it for major decisions.
SAM calculation

The percentage is determined by the constraints that make part of TAM unreachable, geography, product fit, sales model compatibility, and buyer behaviour.
Example: Of the 600,000 manufacturing firms, only 200,000 have 50–100 employees, which is where the product delivers the strongest ROI. SAM = 200,000 × $10,000 = $2 billion.
SOM calculation

Example: The company generated $400,000 in revenue against a SAM of $695,000 last year, giving a market share of approximately 58%. The SAM grows to $715,000 this year. SOM = $414,700. Alternatively, if the sales team can close 1,000 new customers at $10,000 each based on historical performance, SOM = $10 million.
Always sanity-check SOM against sales team capacity. If closing 1,000 deals requires 20 reps closing 50 deals each, and you only have 8 reps, the SOM needs to be adjusted down, or the hiring plan needs to be adjusted up.
Real-world examples of TAM, SAM, and SOM
SaaS company: HR onboarding software
A US-focused HR onboarding platform priced at $8 per employee per month identified 120,000 qualifying companies with 100–2,000 employees. The average employee count of 450 per company produced an ACV of $43,200, giving a TAM of $5.18 billion.
For SAM, the team excluded companies running paper-based HR processes and those locked into enterprise suites. This narrowed the count to 55,000 companies, a SAM of $2.38 billion.
SOM was built from the sales hiring plan: scaling from 5 to 15 reps over three years, targeting 800 customers in year one, growing to 2,500 by year three. Result: 4,800 customers at $207 million ARR by year three.
E-commerce: eco-friendly beauty
A retail chain used a $6.5 billion US eco-friendly beauty TAM. Physical store preference narrowed SAM to $2.99 billion. Focusing on Los Angeles (roughly 1% of the US population) brought SAM to $29.9 million. Targeting 10% of the LA market in the first phase produced a SOM of $2.99 million, a number grounded in specific geography and channel, not an arbitrary percentage.
Mobile app: meditation and wellness
A meditation app calculated TAM from the $11.27 billion global wellness apps market, with meditation representing approximately 20% a $2.25 billion TAM. Filters for US availability (37% of the global market), iOS only (56%), and the 25–54 age group (60%) produced a SAM of $280 million. Year-one SOM as a new entrant with a limited marketing budget: 1% market share, $2.8 million, scaling to $14 million by year three.
B2B: cloud data warehousing
Snowflake segmented a $12 billion analytical database TAM by vertical. Financial services represented a $1.9 billion slice with 93% composite fit across technical requirements, compliance needs, and data complexity, producing a $1.2 billion SAM. Technology added another $1.45 billion to SAM. Phased go-to-market targeting these two verticals first projected 8% penetration by year two, producing a 213 million SOM.
Common mistakes to avoid when calculating TAM, SAM, and SOM
Overestimating your total addressable market
The most common form of TAM inflation is starting with a large industry report number and presenting it without any qualification. "The global CRM market is $80 billion", tells an investor nothing useful about your specific opportunity. Every filter you apply to product fit, geography, and buyer profile makes the number smaller and more credible.
A related mistake is defining SOM as an arbitrarily small percentage of a large TAM without any supporting logic. Claiming "we'll capture 0.5% of the market" without explaining how, how many reps, what conversion rates, and what channels is not a forecast. Investors have seen this framing many times, and it signals that the bottom-up work was never done.
Ignoring competition when calculating the SOM
If two competitors already hold 55% of your SAM combined, your theoretical SOM ceiling starts at 45% before you account for your own execution constraints. SOM without competitive analysis is market share fiction. The players already serving your target customers will defend their position, and that defence needs to be factored into your numbers.
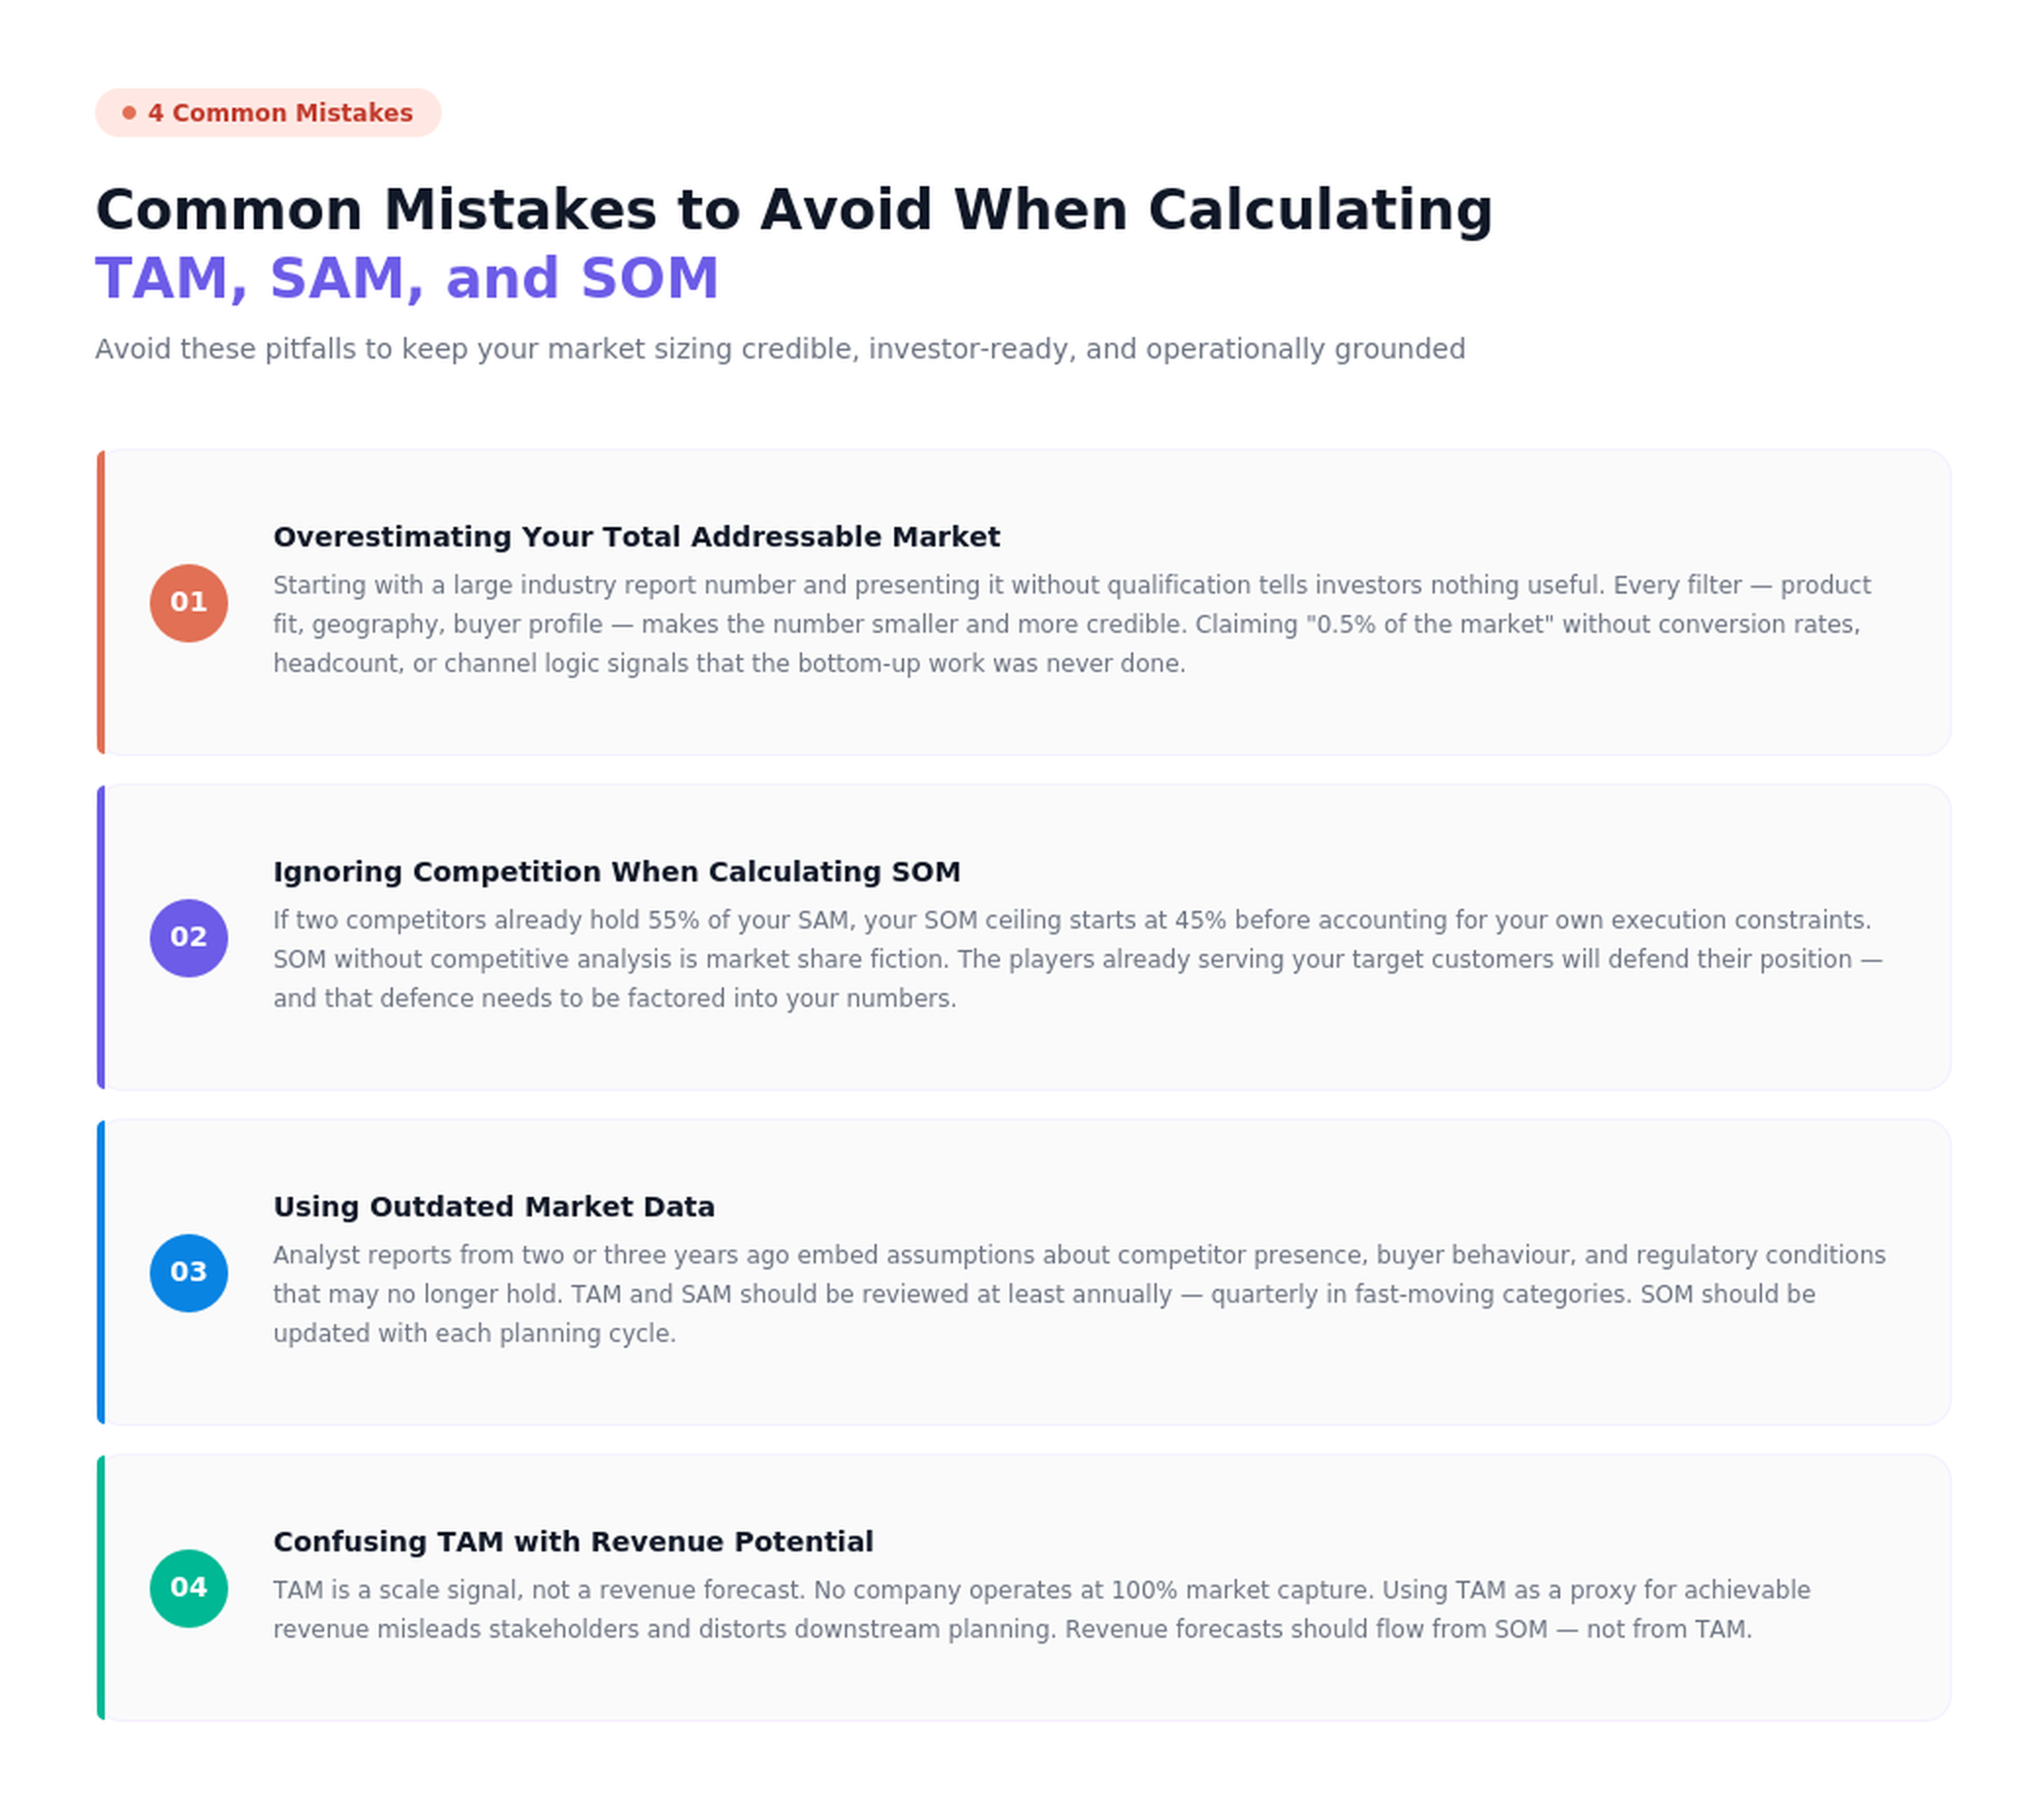
Using outdated market data
Markets shift. Analyst reports from two or three years ago embed assumptions about competitor presence, buyer behaviour, and regulatory conditions that may no longer hold. TAM and SAM should be reviewed at least annually, and quarterly in fast-moving categories. SOM should be updated with each planning cycle.
Confusing TAM with revenue potential
TAM is a scale signal, not a revenue forecast. No company operates at 100% market capture. Using TAM as a proxy for achievable revenue, or presenting it as if it is, misleads stakeholders and distorts downstream planning. Revenue forecasts should flow from SOM, not from TAM.
If you're building a sales pipeline and want to connect your market sizing to actual pipeline coverage targets, the SOM calculation is the starting point; it tells you how many deals need to be in each stage to hit your number.
Final thoughts
TAM, SAM, and SOM are not just pitch deck metrics. They are planning tools that, when built rigorously, surface what is actually achievable, and where the gaps between ambition and capacity need to be closed.
Calculate TAM to validate the opportunity. Build SAM to define where you can compete. Ground SOM in operational reality to set targets you can actually hit. Update all three regularly as your business and market evolve.
The companies that size markets honestly and execute within them with focus are the ones that consistently hit their numbers, because they set numbers that evaluate whether a market opportunity justifies investment, to pitch investors who need to understand the scale of the problem you are solving, and to compare to reality in the first place.