AI & AUTOMATION
Knowledge Graphs Explained: Why Your CRM Needs One in 2025

By Ganesh Ravi Shankar
Last updated on May 26, 2026
Discover how knowledge graphs transform your CRM from a static database into a connected intelligence engine that reveals hidden customer insights.
Knowledge graphs are transforming the way businesses handle their customer's data. Google's version contains more than 500 million objects. Your CRM system collects abundant information, but you miss valuable insights without proper connections between data points.
A knowledge graph works like a smart web that links all your customer's data together. Traditional databases store information differently from knowledge graphs, which connect data through relationships to provide context. The application of these graphs to CRM creates a complete picture of customers by linking information from multiple business systems. Your team can make better recommendations, detect fraud, and create individual-specific experiences. Businesses of all types in retail, finance, and healthcare use this technology. They apply it to enhance upselling strategies and organize complex relationships in research data.
What is a knowledge graph in CRM?
A knowledge graph in CRM is a structured data model that connects customers, companies, deals, interactions, and signals through defined relationships, not just stores them in rows. Unlike a traditional relational database, a graph database CRM maps the how and why behind every data point, enabling AI to surface insights like buying intent, churn risk, and next best actions in real time
Why knowledge graph matters for CRM
Knowledge graphs reshape how we structure and understand data. They build visual networks where connections become just as important as the data points.
Understanding the simple structure: nodes, edges, and relationships
Knowledge graphs combine three main components that show real-life information:
- Nodes: These represent entities like people, products, companies, or events. Your CRM might use nodes to show customers, orders, or support tickets.
- Edges: These show relationships between nodes and explain how entities link to each other. A customer node might connect to an order node through a "placed order" edge.
- Attributes: These describe characteristics of both nodes and relationships. Customer nodes might include names and locations, while relationships could show timestamps.
This structure matches our natural thought process. Think about asking "Do you know a pediatrician in town who speaks Spanish?" Your brain links different concepts: doctor types, locations, and language skills. Knowledge graphs work the same way and make complex business relationships easy to understand.
How knowledge graphs differ from traditional databases
Traditional relational databases keep information in fixed tables with rigid schemas. Knowledge graphs bring several advantages:
Schema flexibility: Knowledge graphs let you add new information as relationships develop. Your CRM adapts as your business grows and changes.
Relationship focus: Relational databases store structured data well, but knowledge graphs emphasize connections between data points. Your team sees customer relationships instantly in a graph instead of searching through multiple tables.
Query performance: Graph databases stay fast even with large, connected datasets. Sales teams get quick answers when searching through thousands of customer relationships.
Natural language compatibility: Knowledge graphs use a subject-predicate-object structure that matches human speech. This makes them perfect for conversational AI and search features in your CRM.
Why Are Knowledge Graphs Useful in CRM?
Google's Knowledge Graph now contains 1.6 trillion facts across 54 billion entities — up from 500 billion facts in 2020. That scale illustrates what becomes possible when data is organized around relationships rather than records.
For CRM teams, the same principle unlocks six capabilities that traditional CRM systems simply can't replicate.
360° customer view
Knowledge graphs create a combined, consistent, and detailed view of each customer that updates instantly across your organization. You get a complete picture by connecting information from sales records, support tickets, social media activity, and transaction history. Sales teams can really understand customer priorities, behaviors, and needs.
Knowledge graphs stand apart from traditional databases by revealing hidden relationships. A retail company using knowledge graphs can instantly connect a customer's online browsing behavior with in-store purchases and support history. This creates truly unified customer profiles.
Smarter personalization
Knowledge graphs excel at linking scattered data points about customer priorities. This enables personalization that resonates with customers. The graph relationships help identify patterns that shape marketing and sales strategies based on individual priorities.
Graph experts call it inference - where two seemingly unrelated products or services connect through shared characteristics. Recommendations now go beyond "others also bought" and truly understand why specific products might appeal to certain customers.
Predictive engagement
Your CRM becomes proactive rather than reactive with knowledge graphs. The system analyzes customer experiences in real-time to spot moments of need or indecision. This triggers the most effective action – whether through a bot, content offer, or human agent.
Companies have seen conversion rates improve by up to 400% using predictive engagement. The technology spots when prospects show genuine interest and clear intent to buy. This allows teams to connect at exactly the right moment.
Improved account-based marketing
Knowledge graphs reshape ABM by providing deeper account insights. Teams gain visibility into account relationships, buying committees, and decision-making processes instead of relying on simple firmographics.
Teams can identify "lighthouse" accounts by understanding how they talk, work, buy, and engage with partners. This creates meaningful conversations with similar accounts that focus on quality interactions rather than campaign volume.
Better support & service
Knowledge graphs link customer history with product information and support documentation. Support teams deliver precise and relevant assistance. AI-powered support tools suggest responses based on past cases and troubleshooting guides.
Unified data integration
Knowledge graphs tackle the challenge of merging data from multiple systems with different formats and schemas. They resolve semantic inconsistencies that often plague traditional data integration methods.
The system allows flexible, incremental integration of new data sources instead of rigid ETL pipelines that break when schemas change. This makes them valuable in ever-changing environments where data structures evolve frequently.
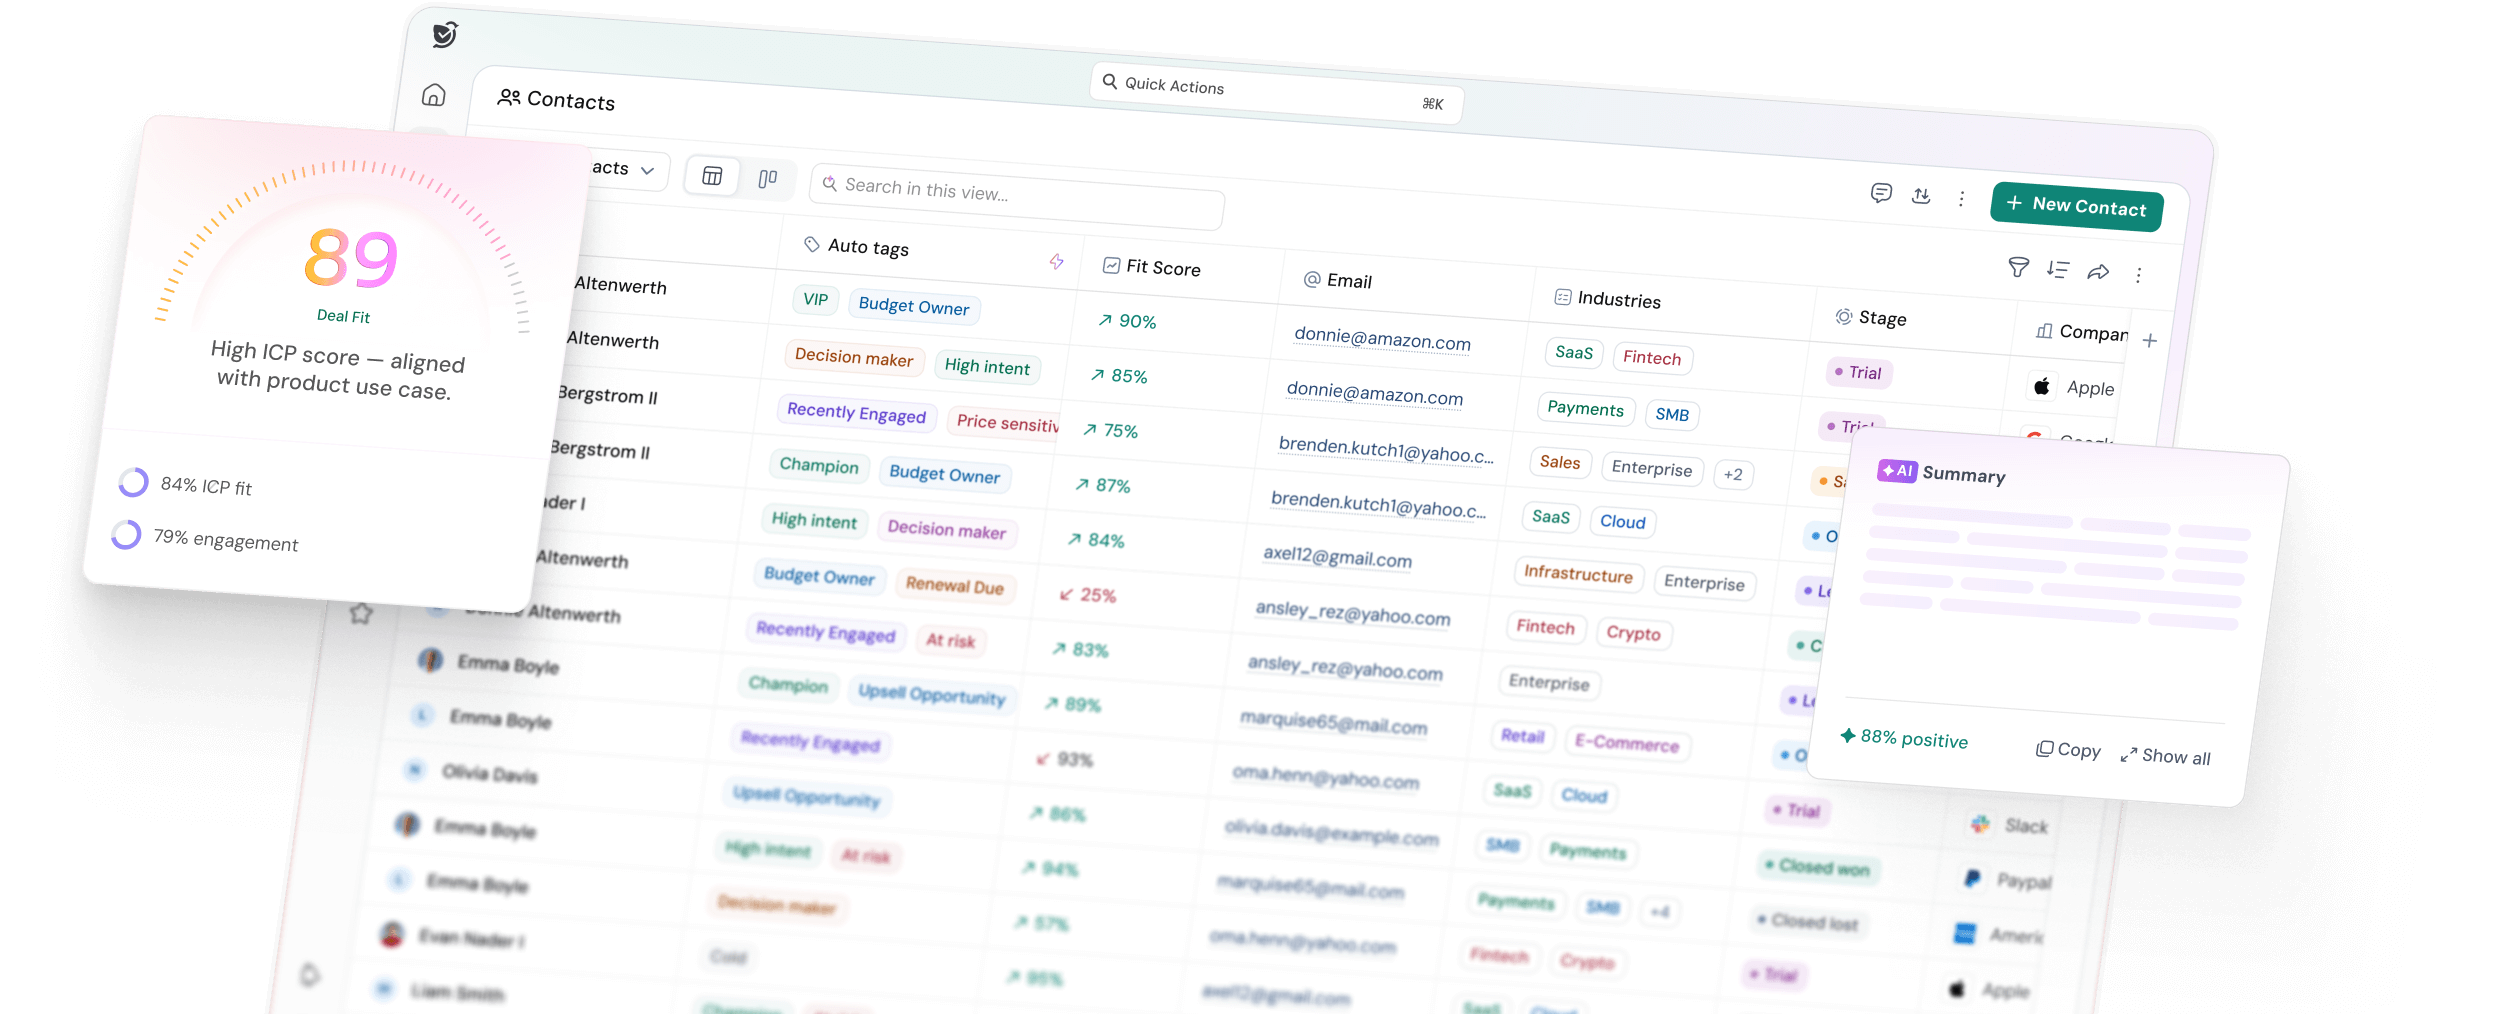
See how SparrowCRM connects every signal to help you close deal faster
The business case: knowledge graph market growth
The enterprise shift toward graph-based intelligence isn't theoretical; it's accelerating.
The knowledge graph market was valued at $1.06 billion in 2024 and is projected to reach $6.93 billion by 2030, growing at a 36.6% CAGR, according to MarketsandMarkets. The graph database segment, specifically, the underlying engine that powers CRM graph intelligence, is expected to grow from $0.51 billion in 2024 to $2.14 billion by 2030 at a 27.1% CAGR.
For CRM teams, this growth reflects a fundamental data problem: customers interact across email, calls, meetings, websites, and support channels simultaneously. A graph database CRM is the only architecture that can map those interactions as a connected journey, not a pile of disconnected records, and give sales reps a live, contextual view of every account.
CRM Use Cases of Knowledge Graphs
Knowledge graphs provide real solutions to everyday CRM challenges that take customer relationships to new heights.
Sales Opportunity Mapping
Knowledge graphs turn scattered customer data into visual networks and reveal hidden sales opportunities. Customer profiles, past purchases, and market trends connect to highlight untapped potential. Sales teams can spot which customers will likely buy specific products by analyzing relationship patterns rather than demographic data alone.
Customer Sentiment Trends
Knowledge graphs do more than capture simple positive or negative ratings. They combine sentiment data from multiple touchpoints to create complete emotional timelines. Large Language Models work with graph-based visualization to track sentiment changes throughout the customer's experience. This helps you spot problems before they grow bigger.
Churn Prediction
Knowledge graph-powered churn models produce remarkable results. A study showed a GraphSAGE model reached 99.46% accuracy and 100% AUC score to predict when customers might leave. These systems look at dropping purchase frequency, unsolved complaints, and negative sentiment patterns to find at-risk customers. Graph structures excel at detecting subtle behavior changes that regular databases often miss.
Cross-Sell & Upsell Recommendations
Knowledge graphs excel at suggesting relevant products by looking at relationship patterns:
- They find customers with similar purchase histories to suggest products they haven't bought
- They link products from the same category based on matching attributes
- They consider margin, commission, and inventory availability to optimize recommendations
This approach delivers product suggestions at the right moment and boosts conversion rates.
Dynamic Org Charts
Knowledge graphs drive interactive organizational charts that help sales teams direct complex customer companies. These visual hierarchies show reporting relationships, find the core decision-makers, and track influencers within accounts. Sales teams can mark contacts as "Decision Maker," "Influencer," or "Blocker" to see stakeholder influence. This ensures they talk to the right people at each account.
Unifying Multi-Channel Journeys
Customer journeys aren't linear anymore. Knowledge graphs create smooth experiences across all touchpoints. They monitor customer interactions everywhere—website clicks, email opens, purchases, or support tickets—to build unified profiles. Businesses can deliver consistent branding, tailored content, and smooth transitions between channels. This creates better customer experiences no matter where they start.
Integrating Knowledge Graphs with AI and CRM Systems
Modern AI systems combined with knowledge graphs create powerful new capabilities for your CRM. Your raw data transforms into genuine customer understanding through this integration.
How GraphRAG and LLMs benefit from knowledge graphs
GraphRAG (Graph Retrieval-Augmented Generation) takes AI responses to the next level by adding structured knowledge. This system builds knowledge graphs from documents and identifies key relationships between entities. The information gets organized into meaningful structures that make sense.
GraphRAG processes questions through your CRM in two different ways:
- Global Search: Handles questions about your entire customer base using community summaries
- Local Search: Provides answers about specific entities by connecting them to nearby data points
The outcome delivers accurate, relevant responses that clearly show where the data comes from. GraphRAG bases AI outputs on your actual business relationships, which greatly reduces mistakes or "hallucinations" in responses.
Using graph database CRM for up-to-the-minute data analysis
Graph databases are great tools for modern CRM systems because:
Unified customer views: Knowledge graph CRMs connect information from multiple sources into a complete picture. The core team sees all customer interactions at once instead of scattered pieces.
Performance at scale: Graph databases maintain quick query speeds even with thousands of connected customer records. Customer interactions get immediate insights without waiting for complex relationship processing.
Dynamic adaptation: Graph CRMs adjust as customer relationships change without needing a complete rebuild. New relationship patterns emerge naturally as your business learns about customer behavior.
Connecting SAP HANA, Datasphere, and CRM platforms
SAP environments can use knowledge graphs as a semantic layer between HANA databases, Datasphere systems, and customer-facing CRM tools. This setup helps companies get more value from their existing data investments.
The semantic layer works as a crucial bridge that improves how AI tools work with your knowledge graph. AI doesn't generate queries directly - instead, it takes parameters from customer inputs and applies them to templates based on intent. This creates more reliable and useful interactions with customers.
What to look for in a graph database CRM
Not every CRM that mentions AI actually uses graph-based data architecture underneath. Here's how to evaluate one:
Data model: Does the CRM store relationships as first-class objects or just as foreign keys between flat tables? A true graph model means a contact's link to a deal, company, and competitor mention all exist as traversable edges that your AI can query in real time.
Real-time inference: Can the system conclude connected data as it changes? When a contact's engagement drops and a competitor is mentioned in the same week, does the CRM automatically surface that as a combined risk signal, or does your rep have to manually connect the dots?
Buying committee mapping: Graph CRMs naturally model multi-stakeholder deals. Look for a CRM that classifies contacts by buyer type (Decision Maker, Influencer, Economic Buyer, Gatekeeper) based on behavioral patterns and meeting data, not just their LinkedIn job title.
Cross-object AI: The real test is whether AI features work across objects, contact + company + deal + activity, or only within one record at a time. If your CRM's AI can only tell you about a contact in isolation, it isn't working with graph-based intelligence.
SparrowCRM's buying committee analysis maps all contacts within an account into decision roles automatically, using relationship signals from emails, meetings, and call transcripts. Its predictive lead scoring draws on connected signals across your entire CRM, not just individual contact fields, to help you prioritize the right accounts at the right time.
For teams evaluating options, the CRM comparison guide breaks down how leading platforms handle data architecture and AI capabilities side-by-side.